₿itcoin’s conflicting signals

Although BTC has gained $8,000 over the past three weeks, and yesterday broke and closed above its 50-day moving average for the first time in three months, it is too early to presume that it is experiencing a Bull Run. Many of the technical indicators that traders use to decipher if a market is bullish or bearish point to different conclusions.
From the viewpoint of a daily candlestick chart Bitcoin, it appears that the momentum is to the upside, and the strength of the bulls has been increasing over the past two and a half weeks. Today however, it could not overcome the significant resistance residing just above $44,200.
Intraday it did make a high of nearly $45,500 on a four-hour chart we can see that this area is still under the bear’s control.
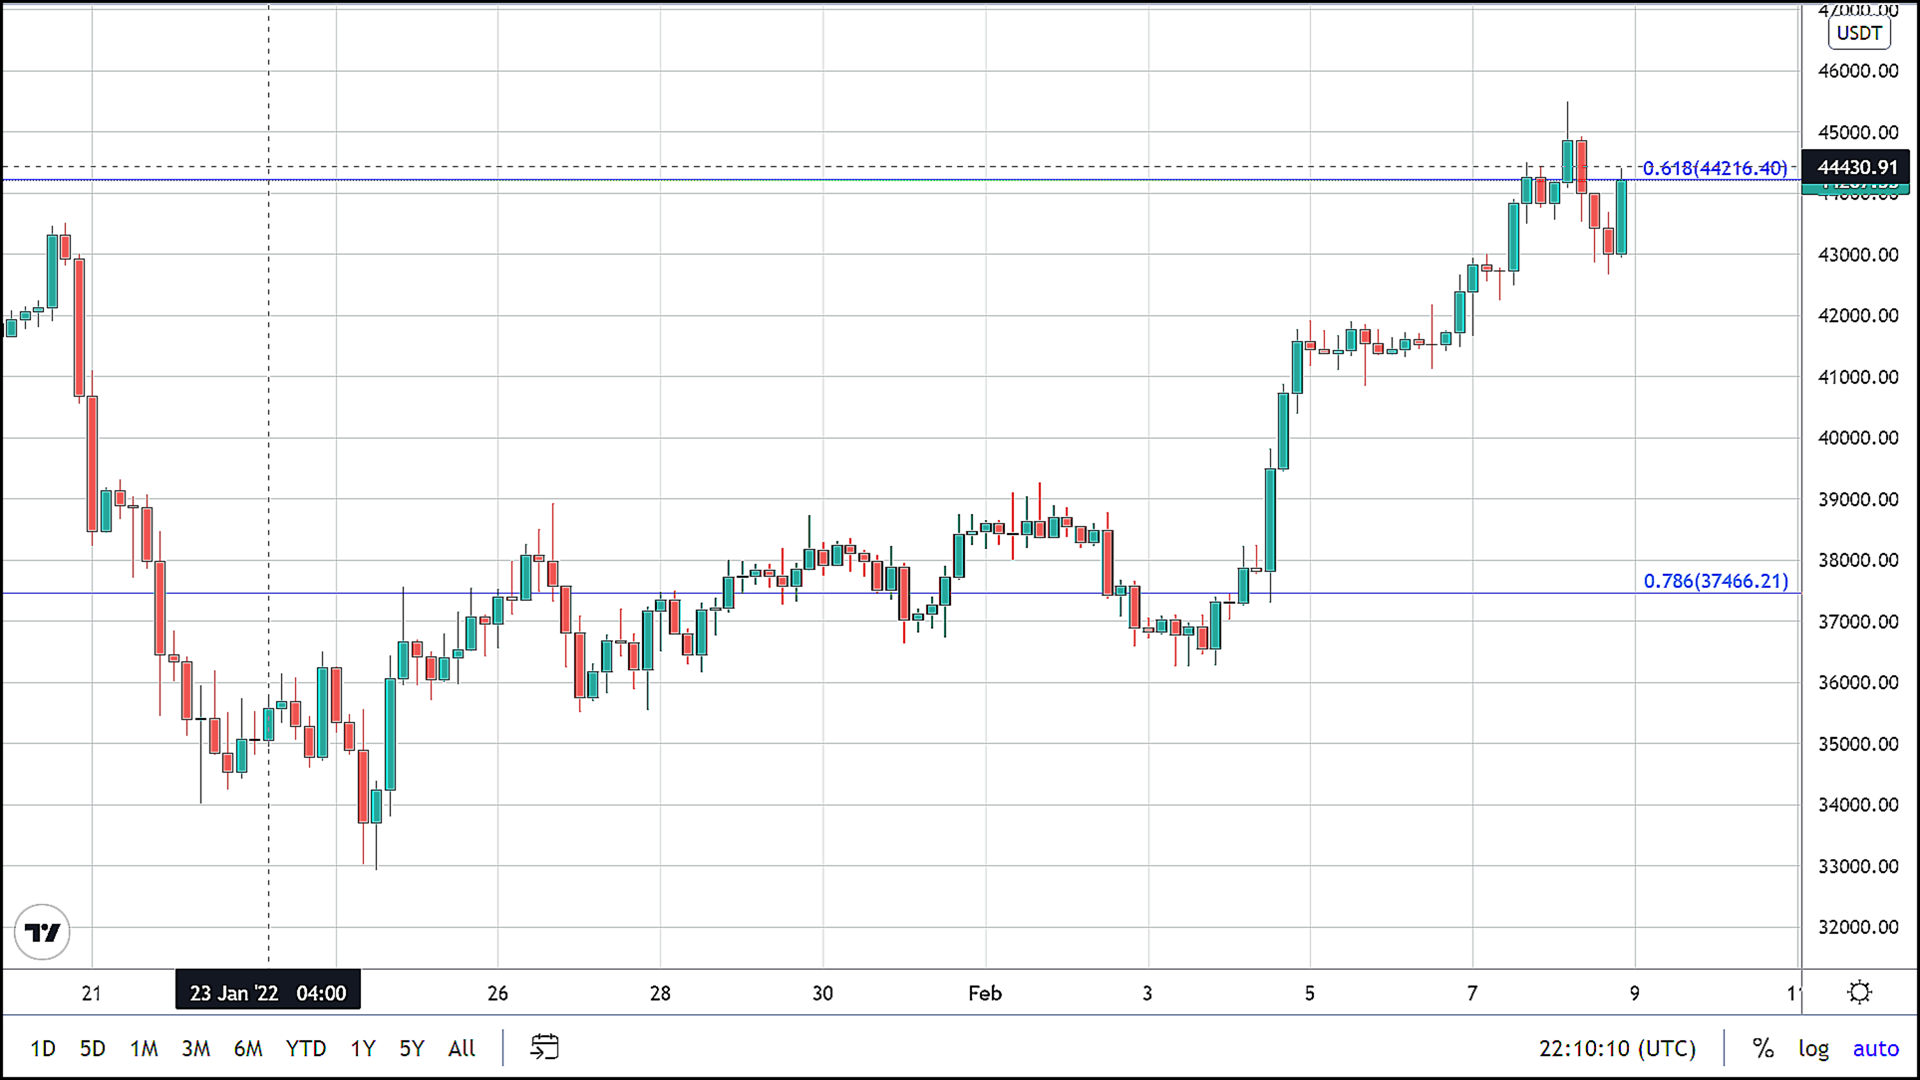
After hitting a low of $33,000 on January 24, Bitcoin’s price assent was comprised of very small-bodied candles forming nine consecutive “Doji.” This slow climb took the market above the 78% retracement. Still, on the ninth day after hitting the lows achieved on January 24, Bitcoin failed to trade above $40,000, hitting the 21-day exponential moving average. After the botched attempt to move past $40,000, the market corrected losing the gains of the previous eight days taking it back below the 78% retracement.
Half of the gains made over the last three weeks occurred two days after this correction on February 4, in which BTC made the largest gains of any single day since November 8, 2021, when Bitcoin made the highest closing price on record at nearly $67,500.
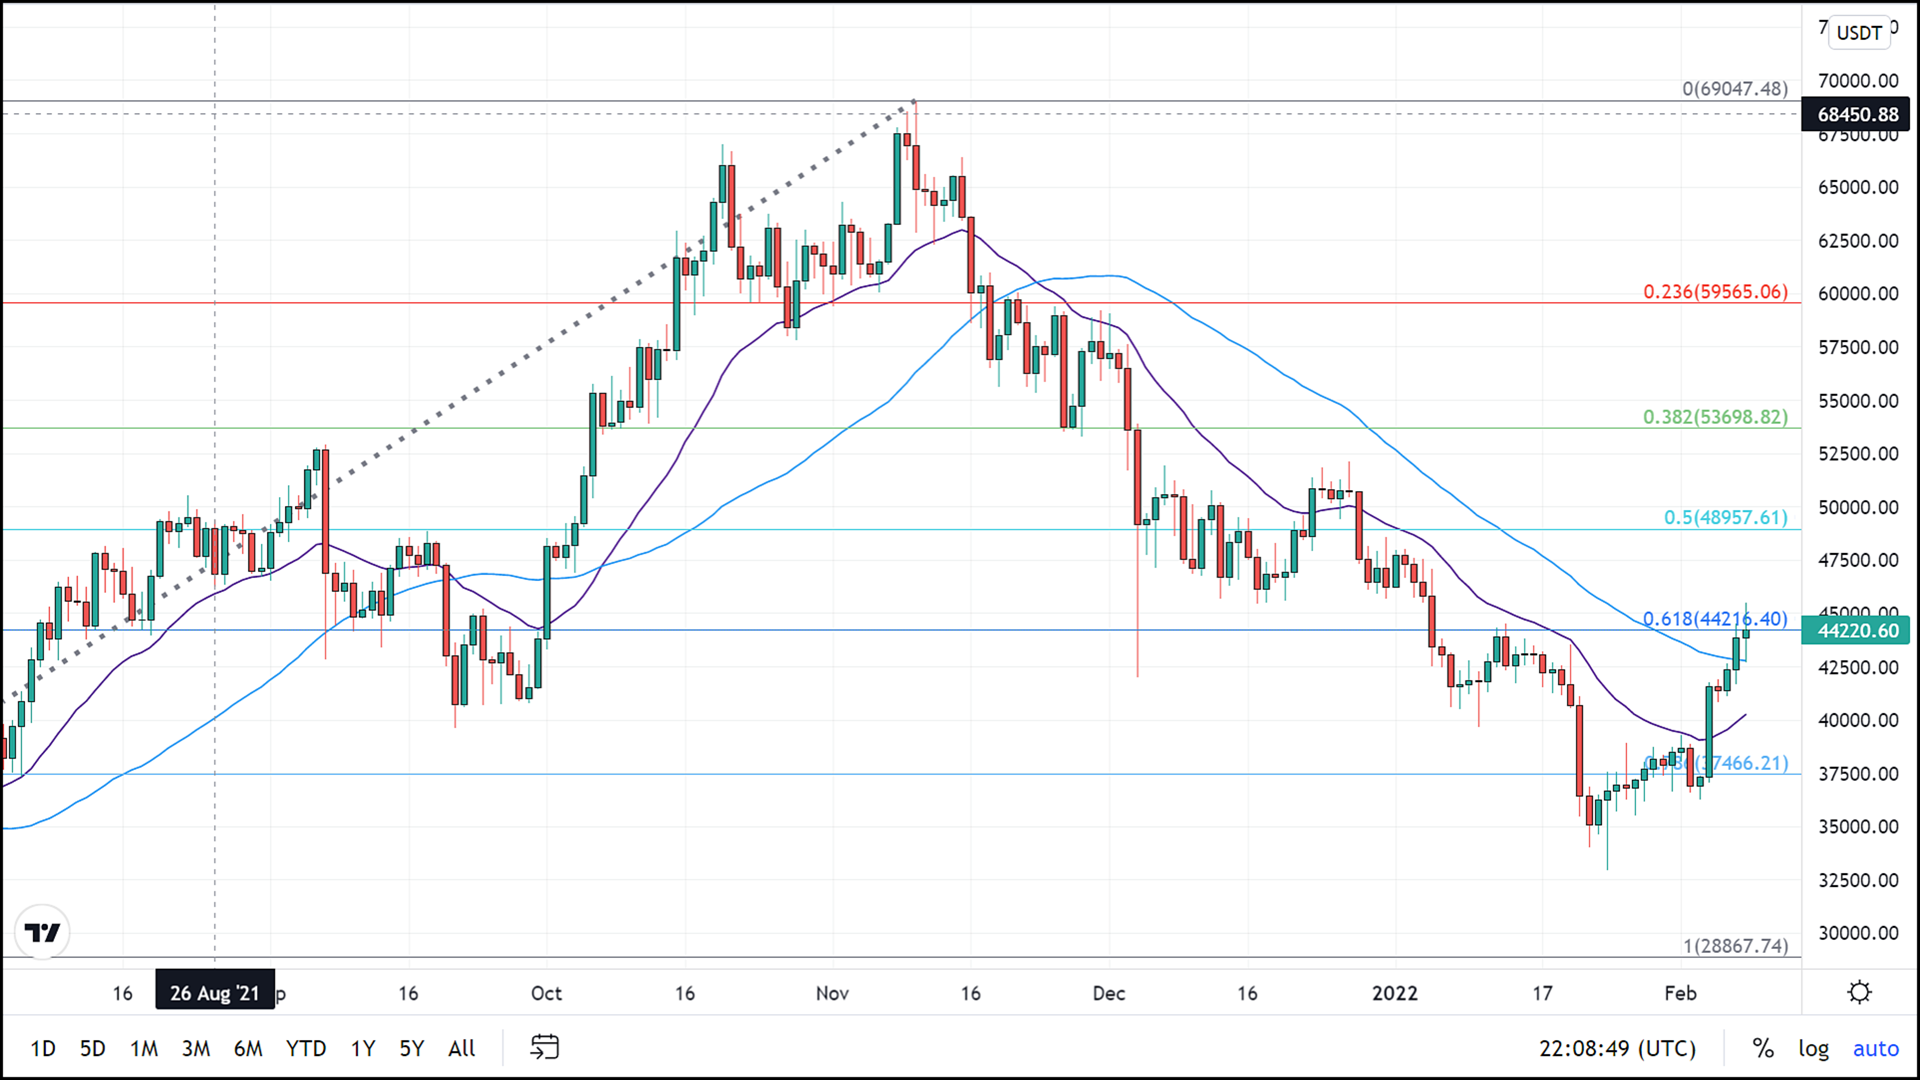
So, the daily candlestick charts allude to a range-bound market with the possibility of a substantial breakout. Dependent on whether it can achieve a clear-cut closing price well above the crucial resistance at $44,200, the 61.8% retracement from the lows in June to the all-time high in November. A bullish cross of the 21-day exponential moving average moving above the 50-day simple moving average would certainly back up the narrative that a bullish breakout was underway.
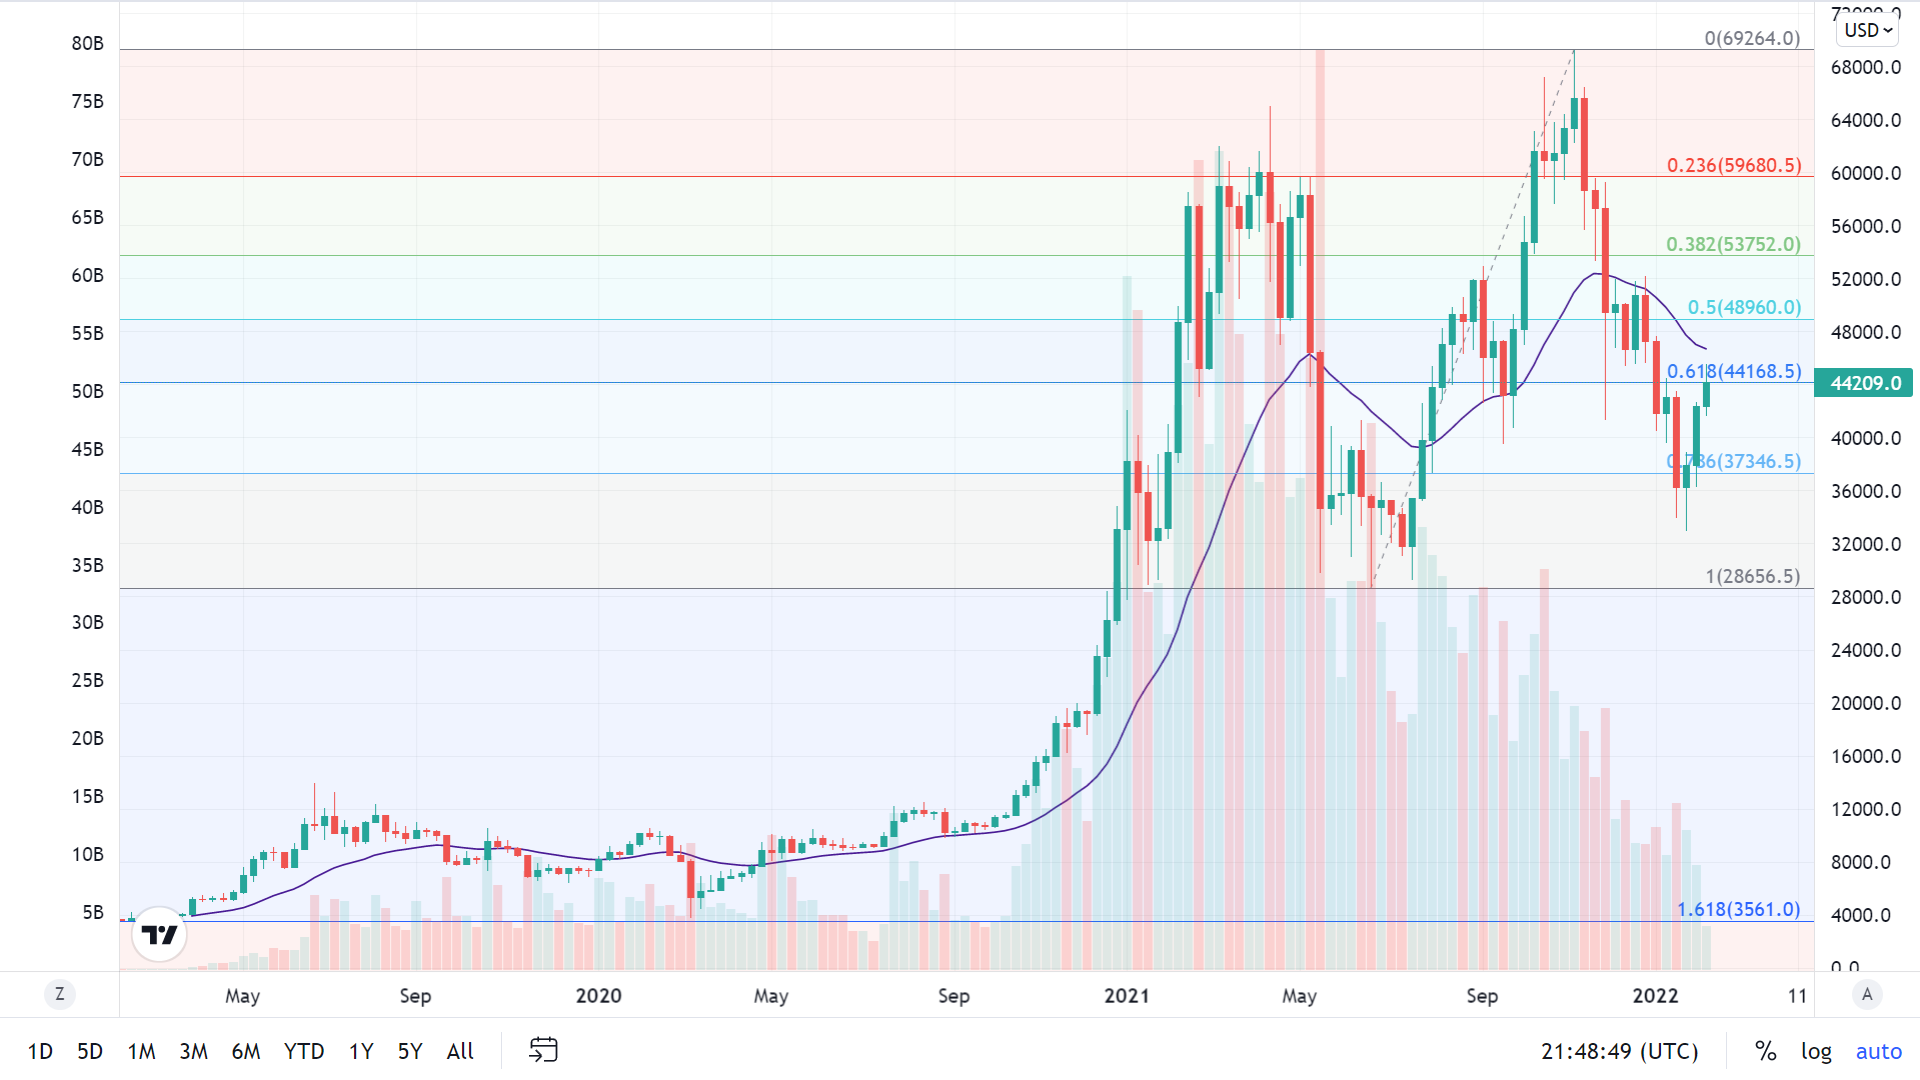
Viewing a weekly candlestick chart encompassing the last two years reveals a completely different picture emerges. Although the last two major rallies that took pricing above $60,000 appear very similar in composition there is one metric that differentiates the two cycles. The first Bull Run that began in October of 2020 and concluded in April 2021 took the record price from $30,000 and doubled it to $60,000. In this historic rise the trading volume backed up the gains rising from below $5 billion weekly to above $70 billion per week climbing higher in sync with pricing. Ever since reaching the first apex in April 2021, trading volume has been steadily decreasing throughout the entire correction and the subsequent second apex in November 2021 as well as the correction that followed. This decrease in trading volume continues to this day and has yet to show any signs that it has bottomed and is starting to regain the kind of interest it had back in spring of 2021.
Bear or bull, which is more likely?
While trading volume paints the picture that the strength that backed the rally in Spring 2021 has peaked, it leaves the possibility that the tops above $60k were both parts of one cycle and if we see trading volume rise at any point it could indicate that a new cycle has begun. The future price movement of Bitcoin has yet to be clear cut in the short term until we get a solid breakout above the 61.8% Fibonacci retracement ($44,200) or below $30,000 pricing and its future direction is up in the air. However, at this very moment the bullish scenario appears as though it is destined, and today could end with the breakout to the upside we discussed. Should that occur, Bitcoin will have a clear shot at $50,000 before any resistance is likely to occur which could spark a new bull cycle in the market.