Is there more upside In Ethereum’s recent run-up?

After a huge boost in the value of Ether, (Ethereum’s native) last month gaining over 50%, traders who are up on their long Ethereum trades might be asking themselves if now is a good time to pull their profits. At the moment (5 PM ET) ETH is down by 5.76% on the day and trading hands at approximately $1,620 and starting the week as its unfinished weekly candle is currently the first red one Ethereum has seen in over a month, but I feel there is a good chance that this weeks candle flips to the color of money and forms its fifth green weekly candlestick.
There are technical reasons that lead me to lean towards more upside but more importantly, it is the fundamental events that have me believing the current rally isn’t finished. That’s not to say that Ethereum couldn’t see a pullback before moving higher from its current price.
The main reason I expect that Ethereum could move higher this week is on the announcement that the final test before the merge named Goerli will be launched between August 6th – 12th. This is to be the last test net launched before the final transition to PoS from PoW and will be the only test net that will be maintained for the long run. This puts the timeline for the merge, the most anticipated event in crypto since Bitcoin’s and Ethereum’s inception, somewhere in mid-September.
Ethereum’s technical outlook
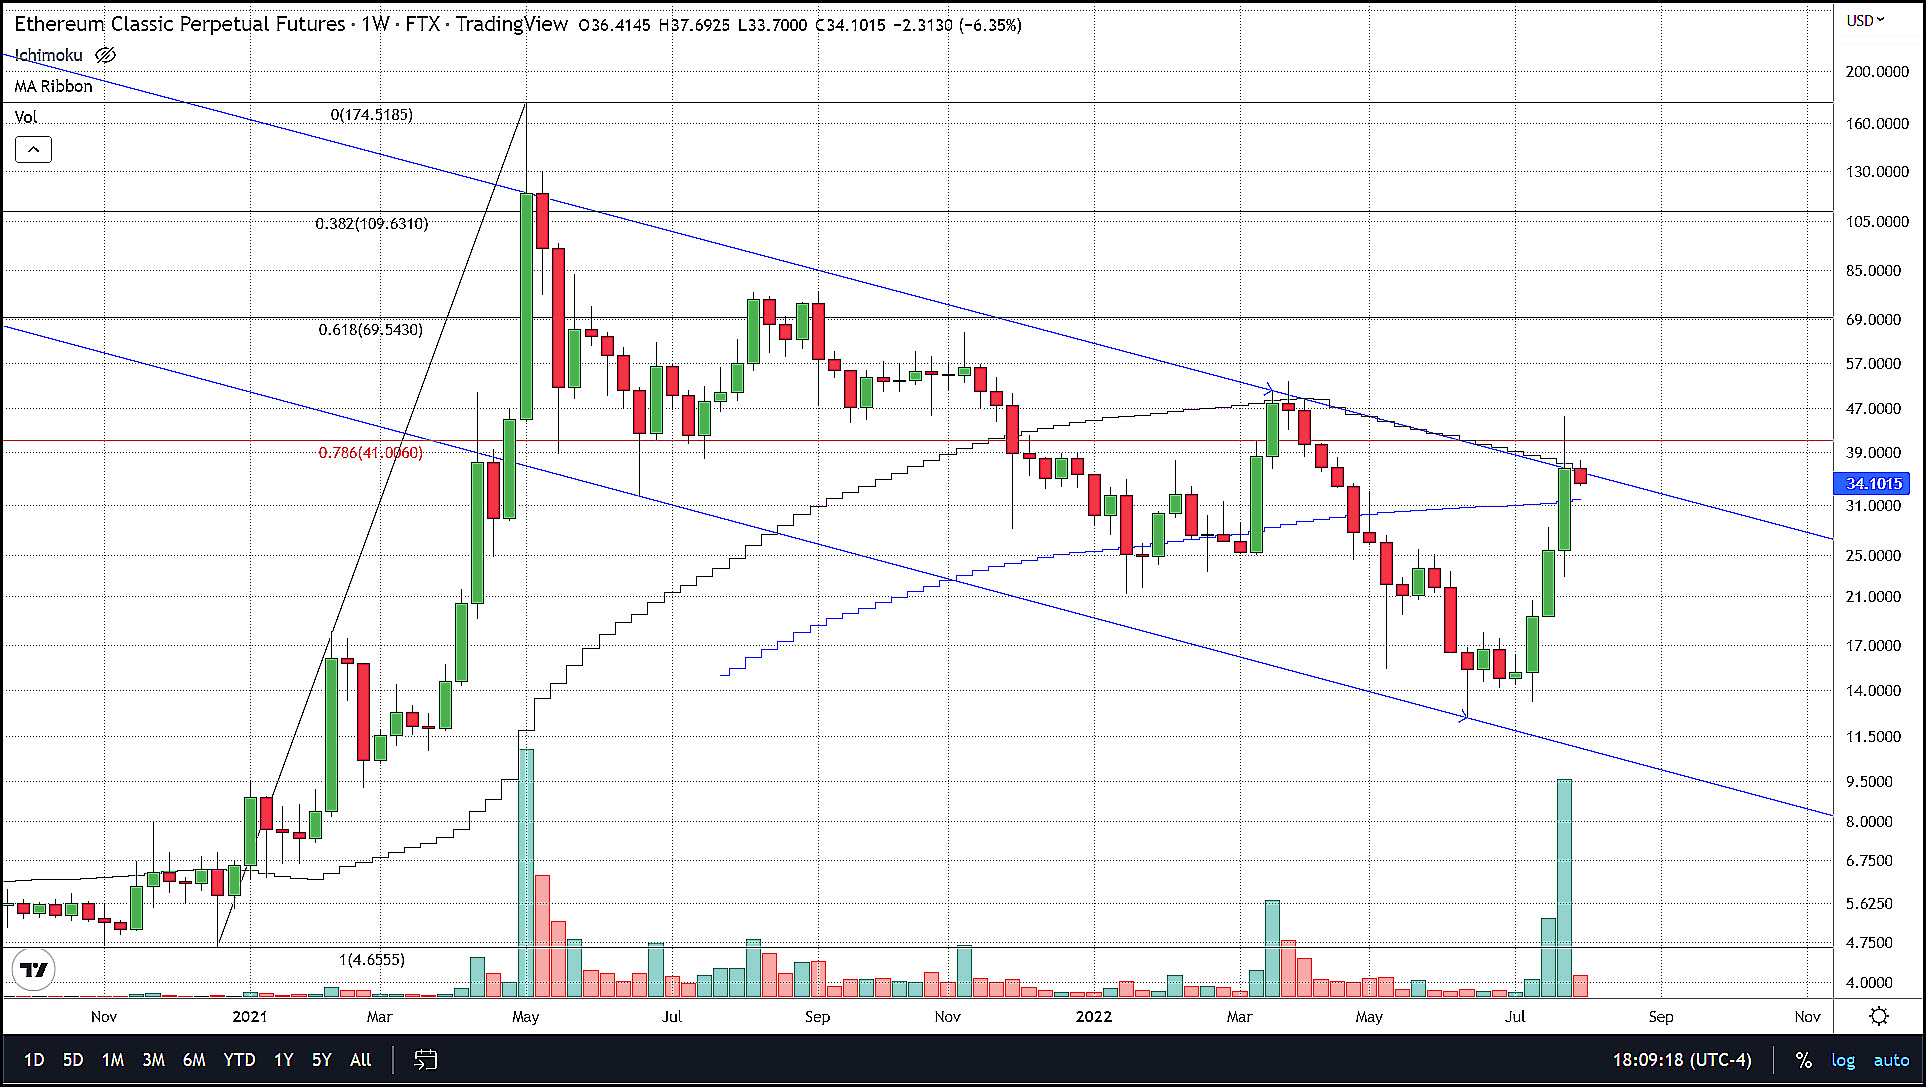
It is hard to talk about post-merge ETH without mentioning ETC (Ethereum Classic) which is the original Ethereum after the hard-fork that followed the infamous DAO hack in 2017. During last month ETC gained almost three times what ETH did over the same period, rallying by 137% last month. Some of this recent attention to the Ethereum hard-fork is since once the merge is finalized all the miners that were mining Ethereum will likely choose to mine a new coin and speculators are betting that coin will be Ethereum Classic.
As we just mentioned ETC has had one hell of a run over the past few weeks but on a technical basis may have hit resistance. In an article by Yashu Gola published on Cointelegraph, the author points out “On the weekly chart, ETC's price has reached a resistance confluence, awaiting a breakout as the euphoria surrounding the Merge grows. The confluence comprises the 0.786 Fib line (~$43) and a multi-month descending trendline.”
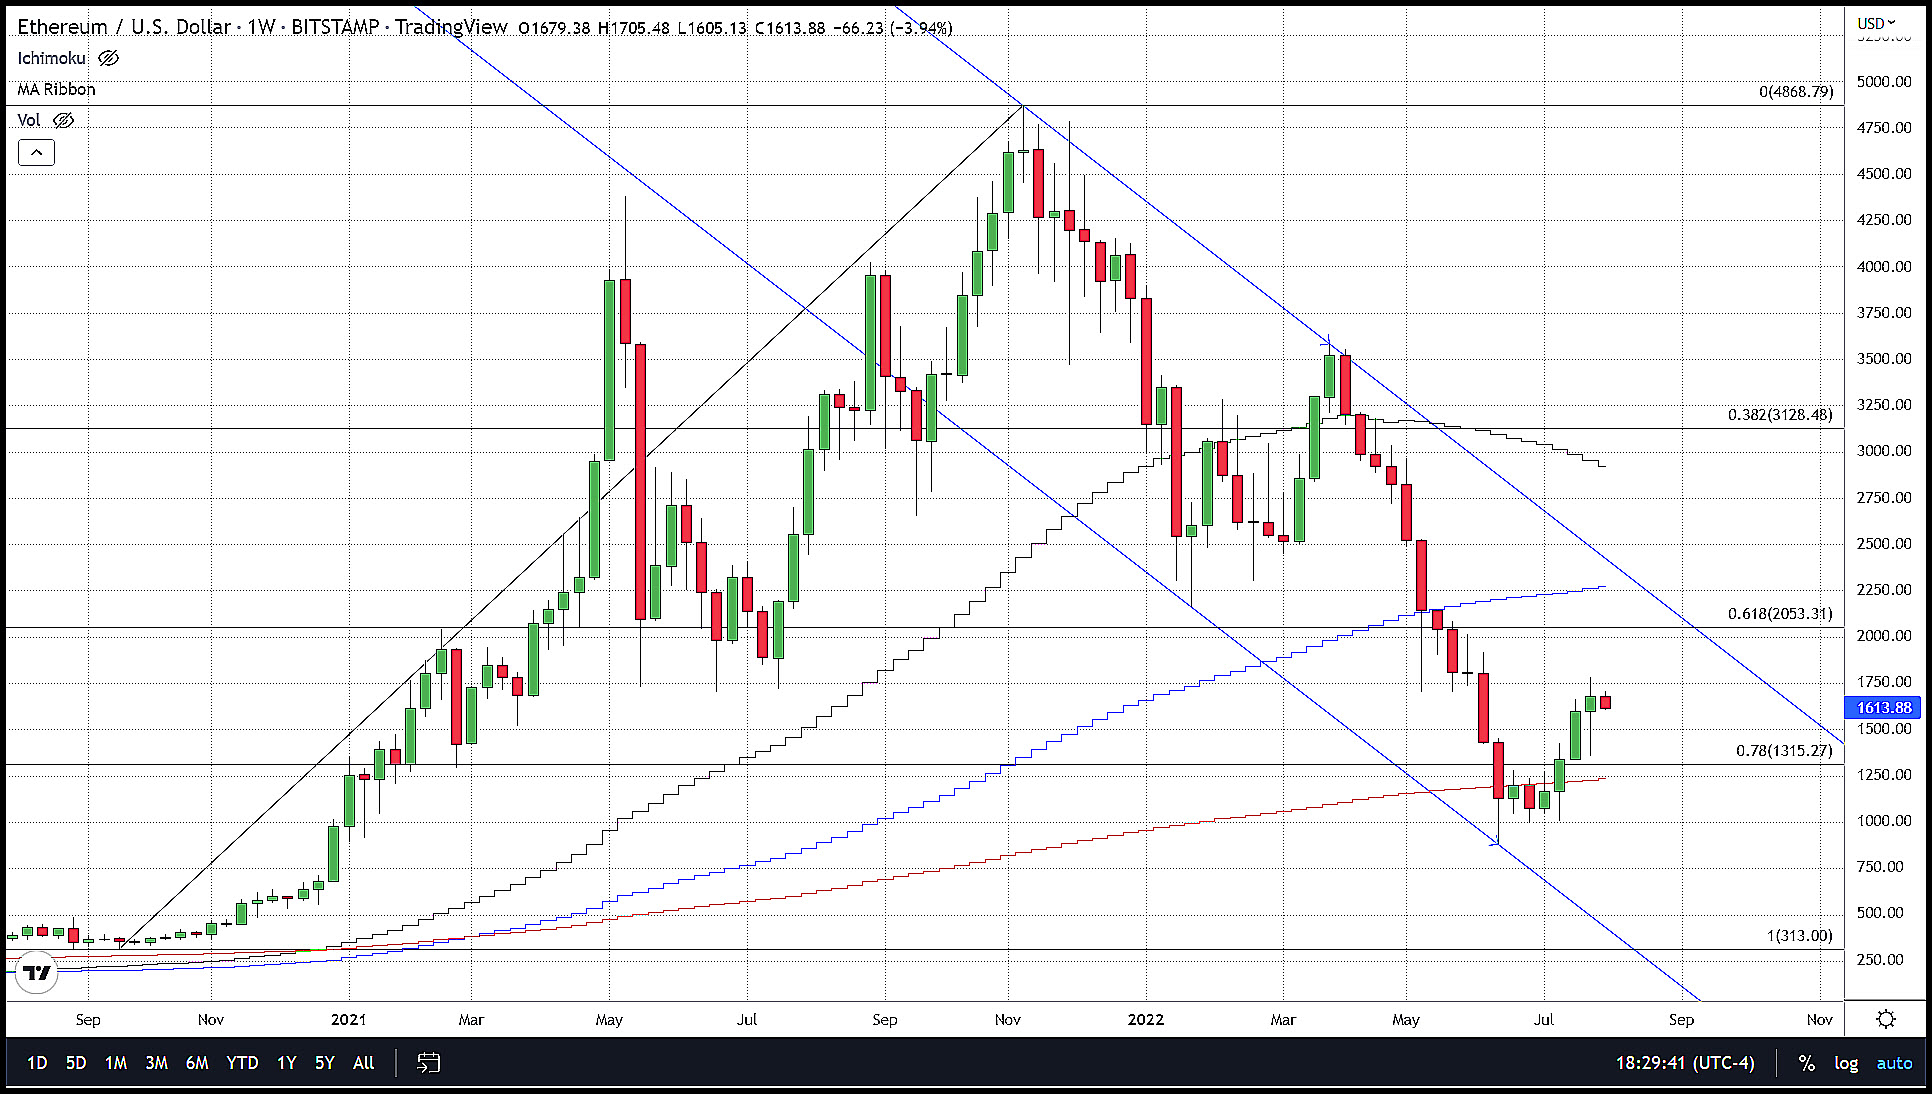
Ethereum’s weekly candlestick chart doesn’t exhibit an imminent top in the market at current levels. It is close to the middle of its multi-month descending trendline and about $800 below its 100-day SMA and $400 beneath the 61.8% retracement just above $2,000. These price points are the next resistance areas Ethereum has to contend with meaning that there is no real technical resistance until $2,000. Ethereum’s current print of $1,620 puts ETH in a good position to move higher still.
For these reasons we are recommending that traders who went long ETH on our July 18th trade recommendation from approximately $1,492 should stay long the market, but we will look to move protective stops higher over the next few days.