Bitcoin is back in rally mode after shallow technical correction

Bitcoin is once again trading dramatically higher after a brief four-day period of consolidation and slightly lower pricing. This correction seems to be technical in nature, likely the result of traders pulling profits. as the CPI report released yesterday revealed steady inflation rates going against forecasts that called for an uptick. This suggests that interest rates may have plateaued and increases the chance of a further pause by the Fed at the next FOMC meeting. This should have been bullish for BTC as it was for most high-risk assets, and bearish for the dollar. However, BTC did not join the major U.S. equities in their sizable moves to higher values supporting the hypothesis that the decline was not fundamentally driven.
The recent decline in Bitcoin's value makes its chart full of strong technical indications, with bullish fundamentals still firmly in place the potential for the current rally to turn parabolic exists. Let us try to breakdown in order to comprehend the scale of the retracement and ongoing rally. Starting at $26,700 on October 12th, Bitcoin surged to an intra-day high of just below $38,000 in less than a month. This represents a substantial 43% gain in 28 days, with 32% occurring in the initial 12 days.
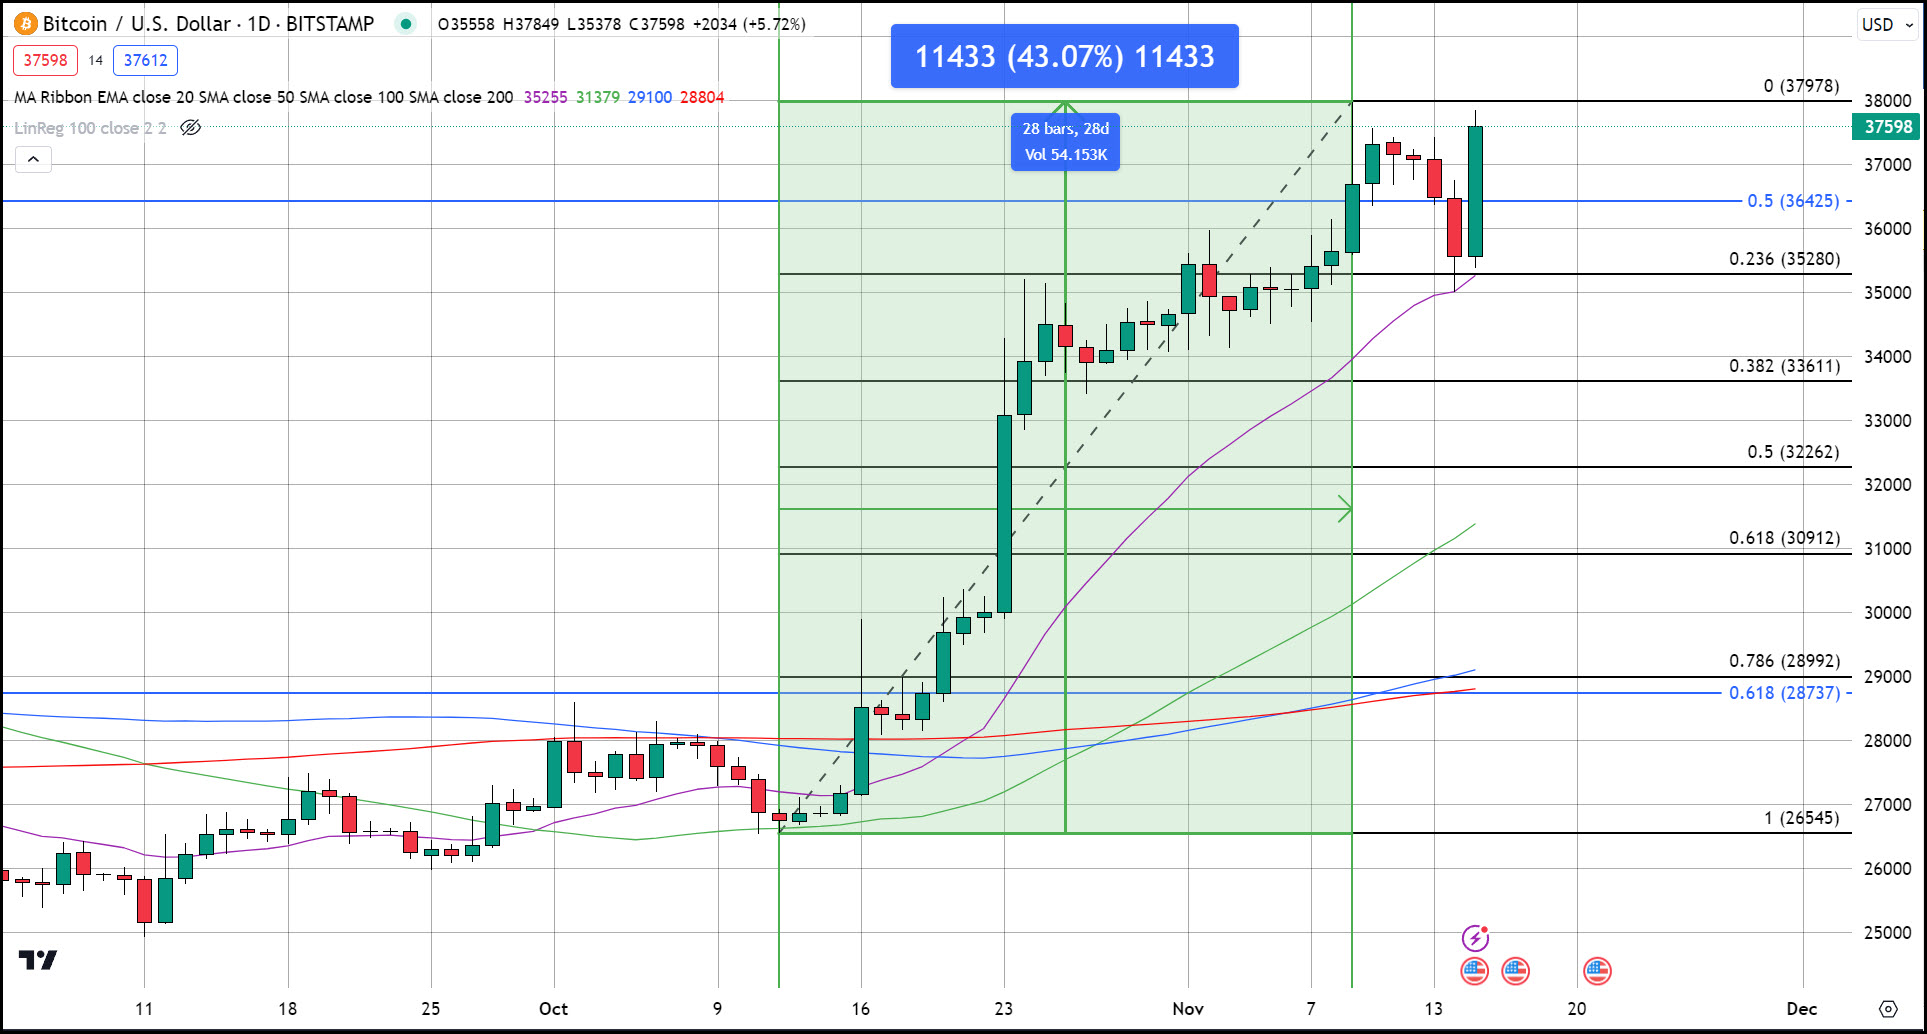
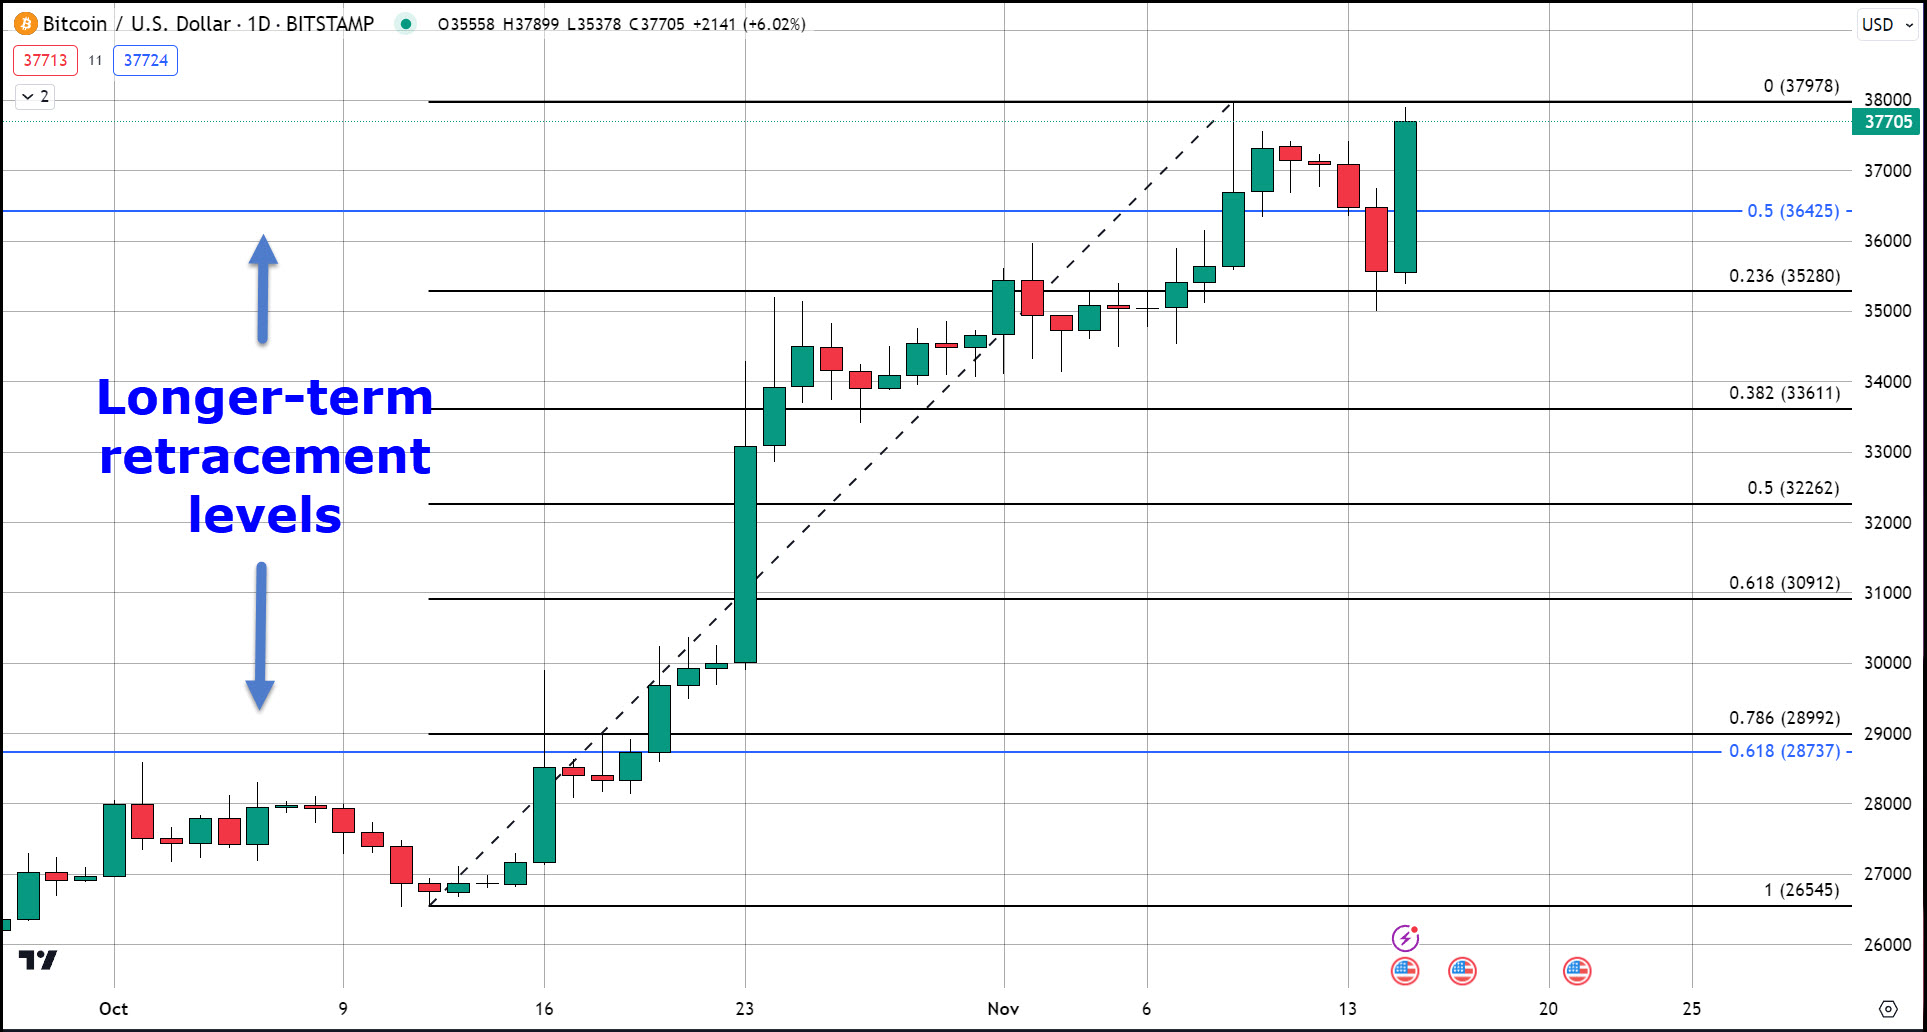
A short-term Fibonacci retracement analysis, spanning the rally, reveals that yesterday's low barely breached the 23.6% Fibonacci retracement level, a level typically exceeded in corrections within all but the most bullish markets. Examining the long-term Fibonacci data set, extending from the recent bottom ($3,500) to the all-time high ($69,000), this rally originated beneath the crucial 61.8% retracement level at $28,737. Despite a brief fall below the long-term 50% retracement level during the recent sell-off, Bitcoin's gain of over $2,000 (5.75%) today has propelled it back above this midway point in its nearly 5-year range. The next level in this data set comes in at $44,000 and therefor accounts for the upper bounds of our next major price target.
Another technical study that illustrates the strong upside momentum in BTC is our moving averages. On October 27th we spoke on the fact that Bitcoin’s major moving averages had all fallen into complete bullish alignment. Since then, the gap between them has widened especially between the shorter-term 50-day simple moving average and the longer two SMAs. Even more so in the 20-day exponential moving average and the 50-day SMA. The 20-day EMA I believe gives the most actionable information of all the moving averages. I use it as one of my filtering tools for deciding whether to execute a trade. Simply put, If A market is above the 20-day EMA I feel more comfortable going long, or if beneath the 20-day EMA I feel more confidence in going short. That is why yesterday’s low was noteworthy in that it touched but did not exceed this moving average. This adds to the case I am making for continued upside potential in Bitcoin.
BTC decoupling narrative gains traction
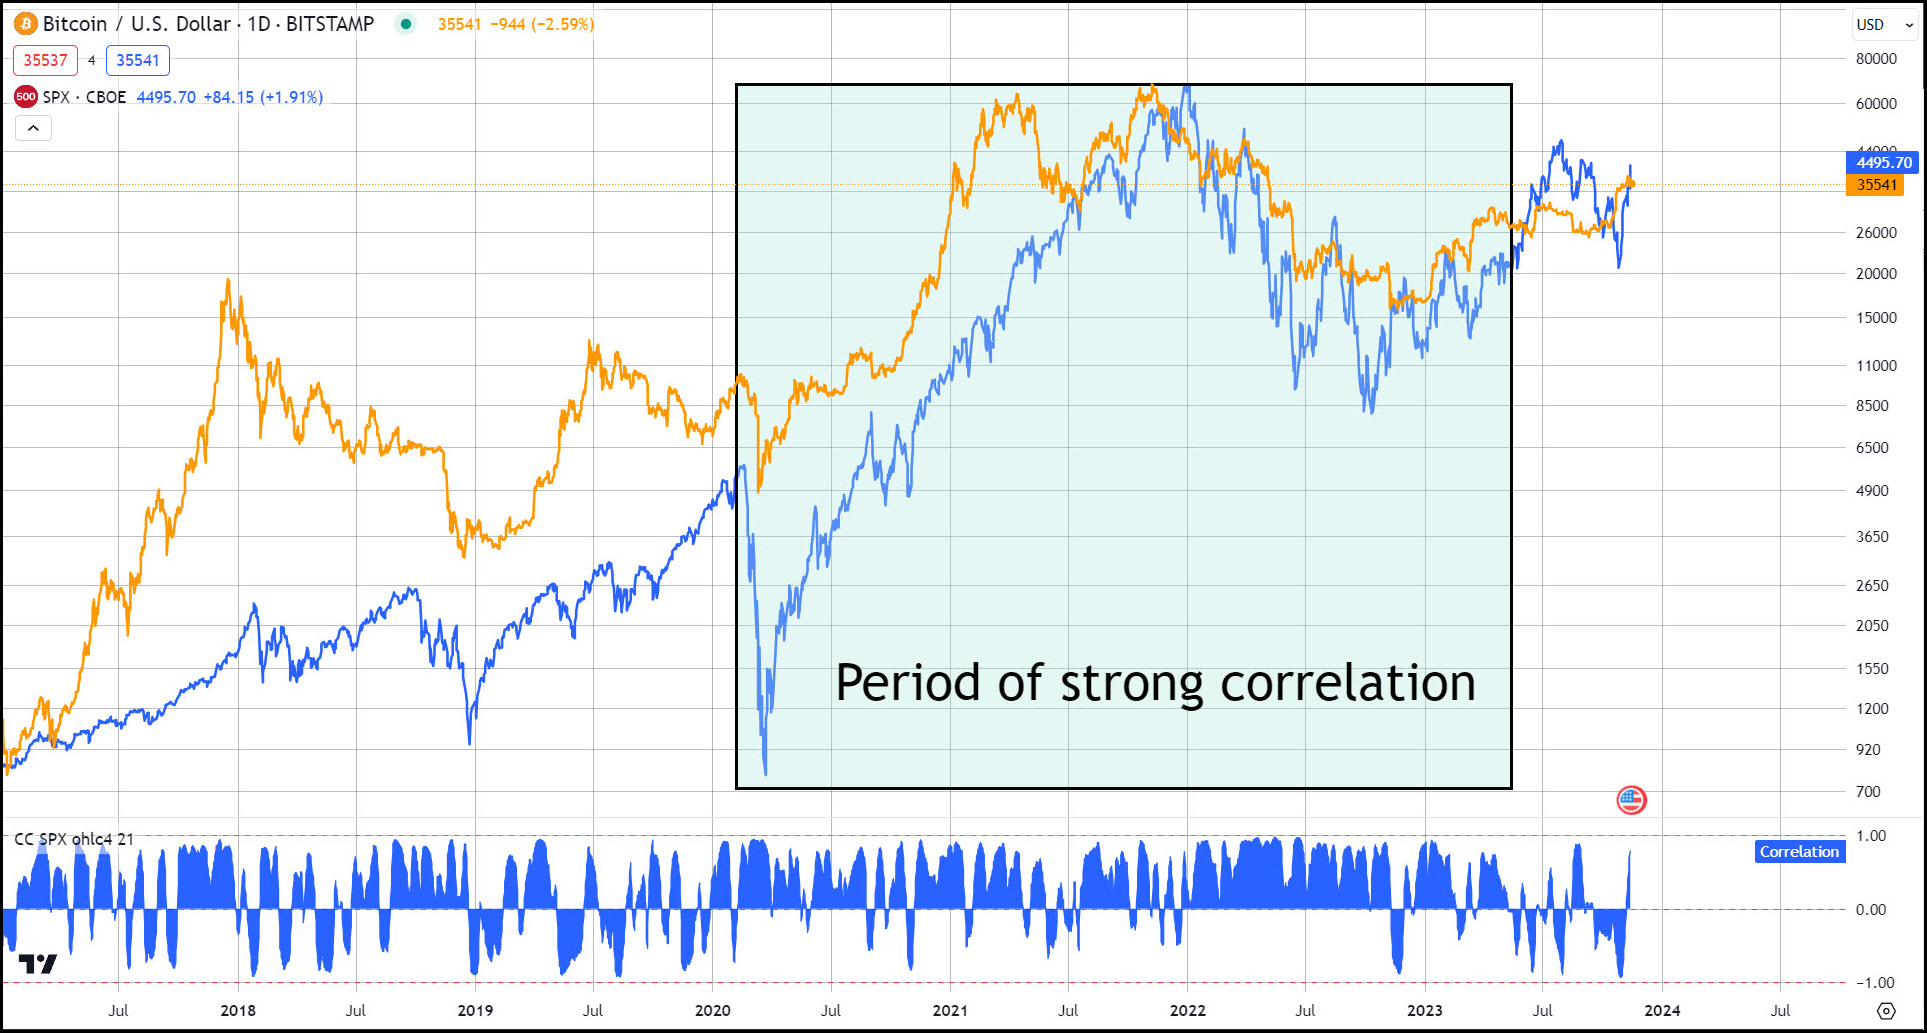
In addition to technical indicators, Bitcoin's recent behavior demonstrates a notable decoupling from U.S. equities. While historically correlated with the S&P 500, Bitcoin has, since the beginning of Spring, shown signs of marching to its own beat. This shift has been eagerly awaited by Bitcoin bulls, marking a departure from the previous positive correlation of BTC and the S&P 500 especially between March 2020 and May 2023. Many analysts have criticized Bitcoin for its synchronicity to the broader risk-on asset class, stating that Bitcoin is simply another growth play. While true Bitcoin believers know it is so much more than that, and does not fit into any label, asset-class or sector that existed before its creation.