Bitcoin breaks into 2023 with full bull force

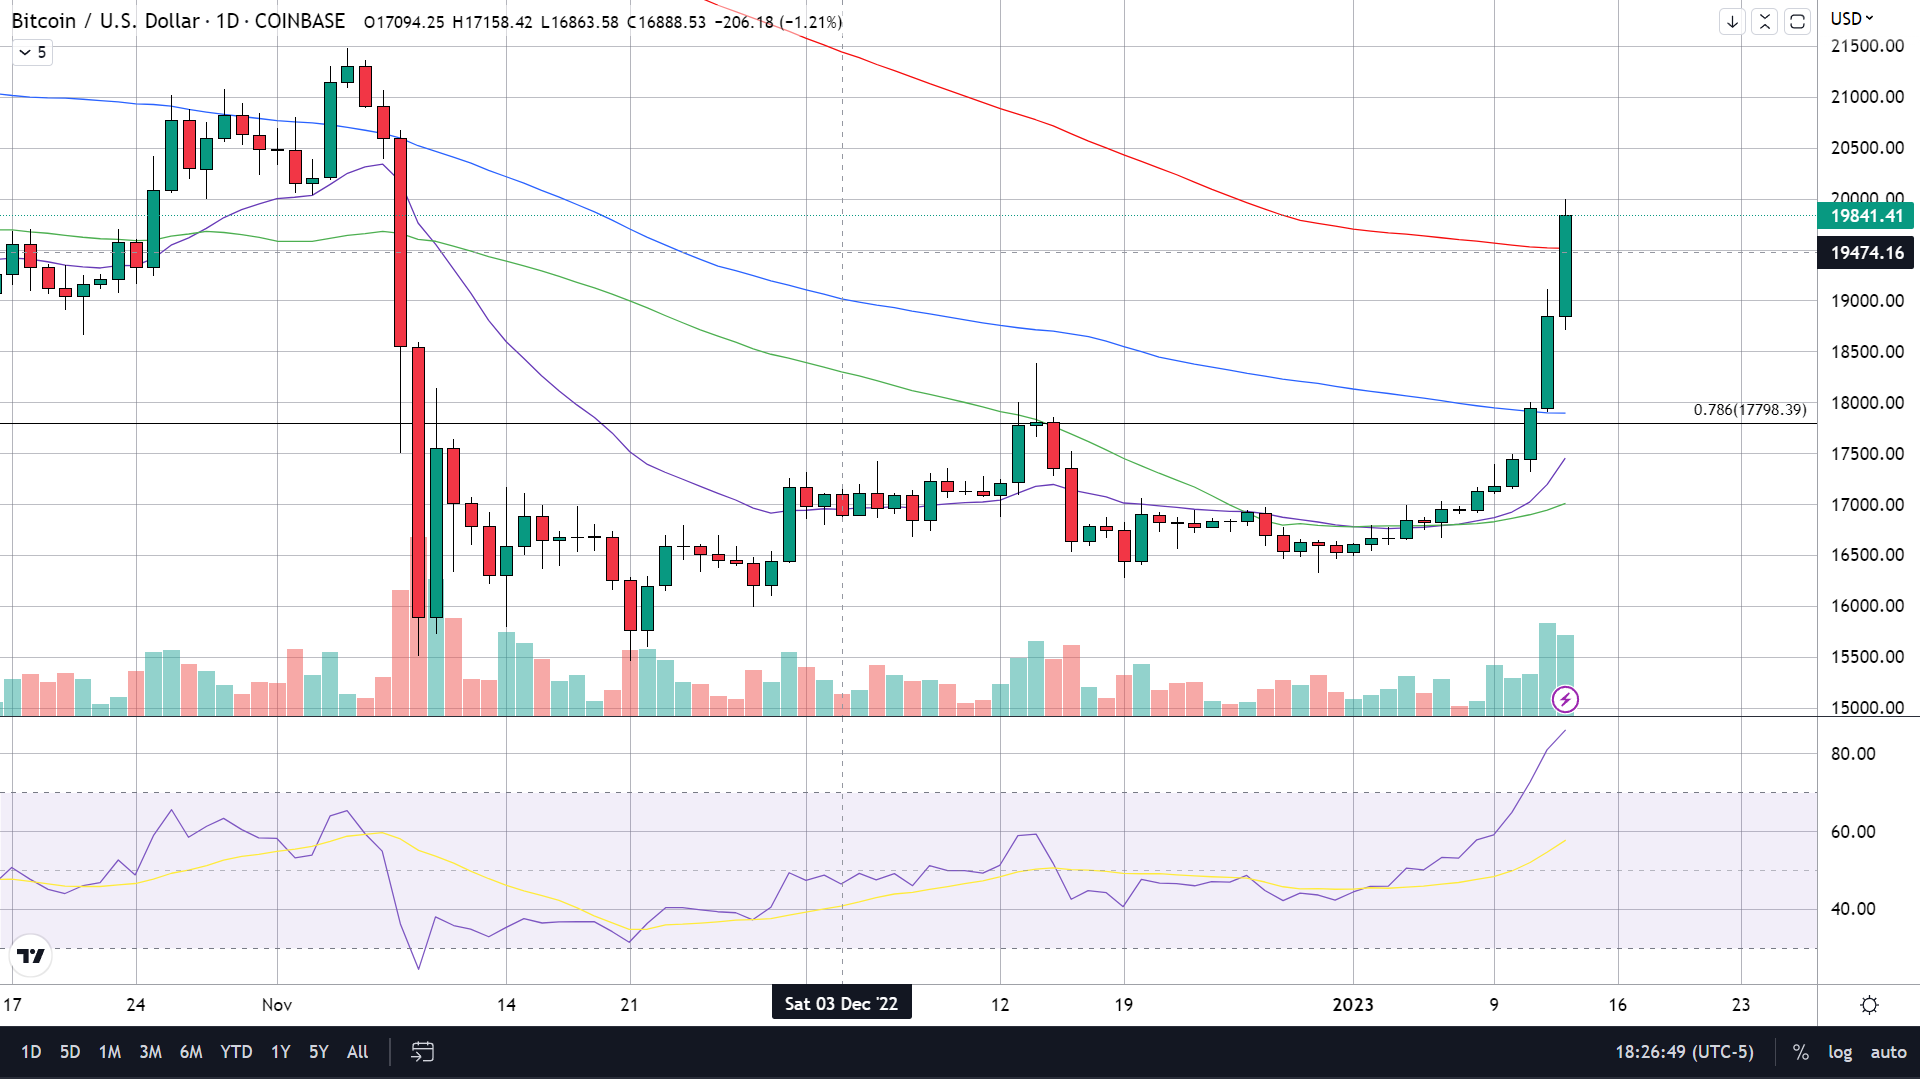
Bitcoin kicked off the new year at $16,531 (Coinbase) and closed on the first day of January only $10 off of the highs at around $16,620. Closing on the highs was just one clue that BTC was about to turn bullish.
Out of the 13 days since the start of the year, Bitcoin’s daily candles are almost entirely green. The only red candles are Doji candles meaning they had a very small body which illustrates that the price change from open to close was extremely small, with only a 0.1% decline on Jan. 5th and a meager 0.03% loss on Jan. 7th.
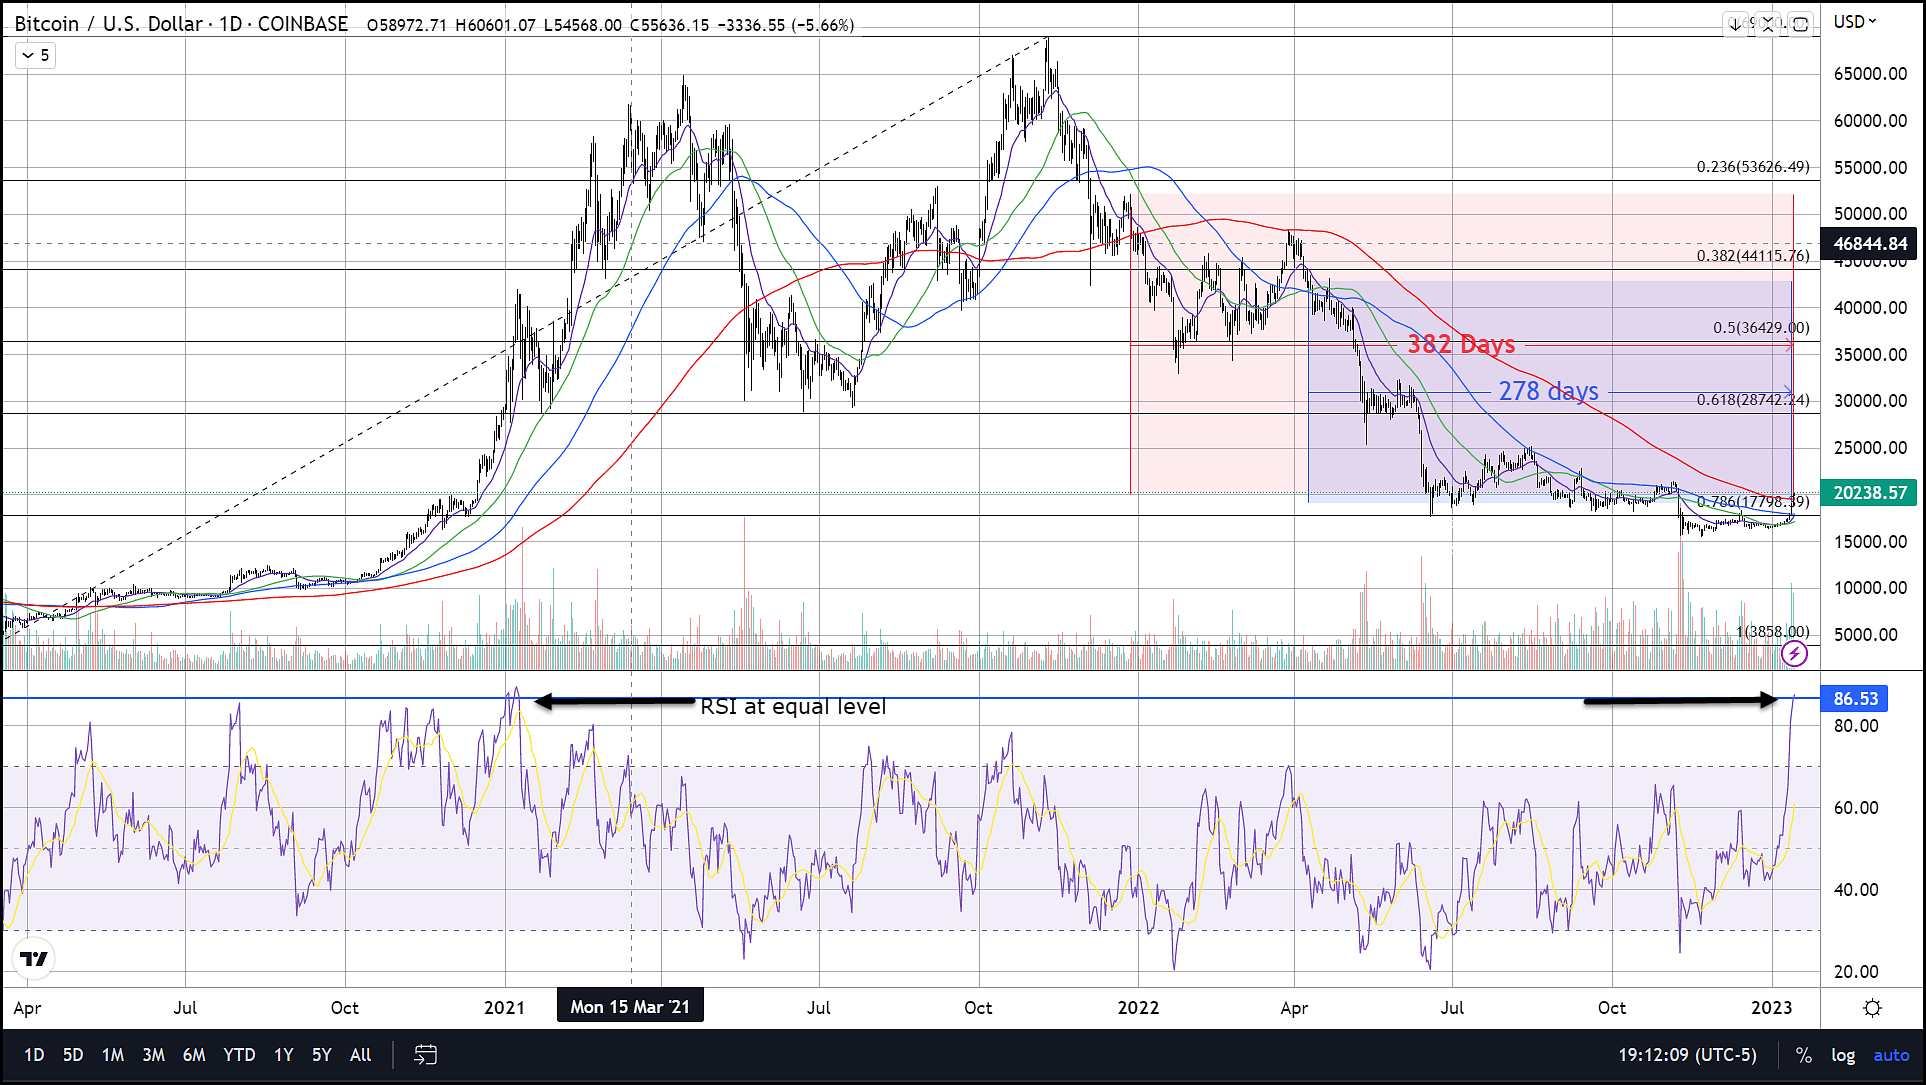
However, the real momentum did not come until BTC took out the level of resistance I have been insistent upon as critical in determining BTC’s future direction. That level is the long-term 78% Fibonacci retracement spanning from the covid crash up to the ATH and comes in at $17,795. This level also marked the low and support up until last November when the FTX fiasco sunk the digital asset below this important level of support turning it into resistance.
On Wednesday of this week that all changed as BTC finally had its first close above the long-term 78% retracement level since crashing beneath it on November 8th, 2022. On that day we also saw futures pricing on the CME fall beneath spot pricing which is a sign that traders are predicting further declines in the future. It wasn’t until the very day BTC broke above the 78% retracement (Wednesday, Jan. 11th) that the price of spot Bitcoin once again was beneath the CME’s future price. From then on BTC continues to have a slight premium or basis (basis = futures price > spot price). Although the CME’s futures contracts are still experiencing some backwardation (closer to expiring months > months with more time to expiration) I believe that this day marks a dramatic shift in the market where bulls now have their hands (weak and strong) firmly on the grip.

Furthermore, on the pivotal day of Wednesday, Jan. 11th BTC broke above the 100-day SMA for the first time (other than a very brief stint in Nov.) in 278 days. The following day this was cemented when it re-tested the 100-day moving average successfully marking this as an area of support now. Today BTC took a step further moving above the 200-day SMA which BTC had been below for over a year (382 days)
So, with so many signs of a market in the midst of a parabolic rally should you enter into a long position? My advice to anyone looking to go long from current pricing should do so with extreme caution and a better tactic would be to wait and see if we get a pullback at $20,000 which we are likely to hit any minute now (Current print as of 6:50 PM ET being $19,890). My advice to traders that are in this group would be to wait the weekend out and enter before or at the New York stock market open on Monday. This would give you a chance to see if we get a pullback here or just barrel through yet another resistance level, either way waiting until Monday shouldn’t cost you that much if it does go against this assumption while if we get a strong pullback, you won’t be far in the red come Monday. I assume some readers already have long positions initiated in that case look to pull profits at this time. One reason I am making these suggestions is the Relative Strength Index or RSI is sitting at an astonishing 86 which suggests that BTC is greatly overbought and therefore overpriced (an RSI of 70 and above signals overbought). The last time we had an RSI at such a high level was in January 2021, exactly 2 years ago. It is for that reason I wouldn’t suggest initiating a long position just yet.