Bitcoin’s current support level is no surprise

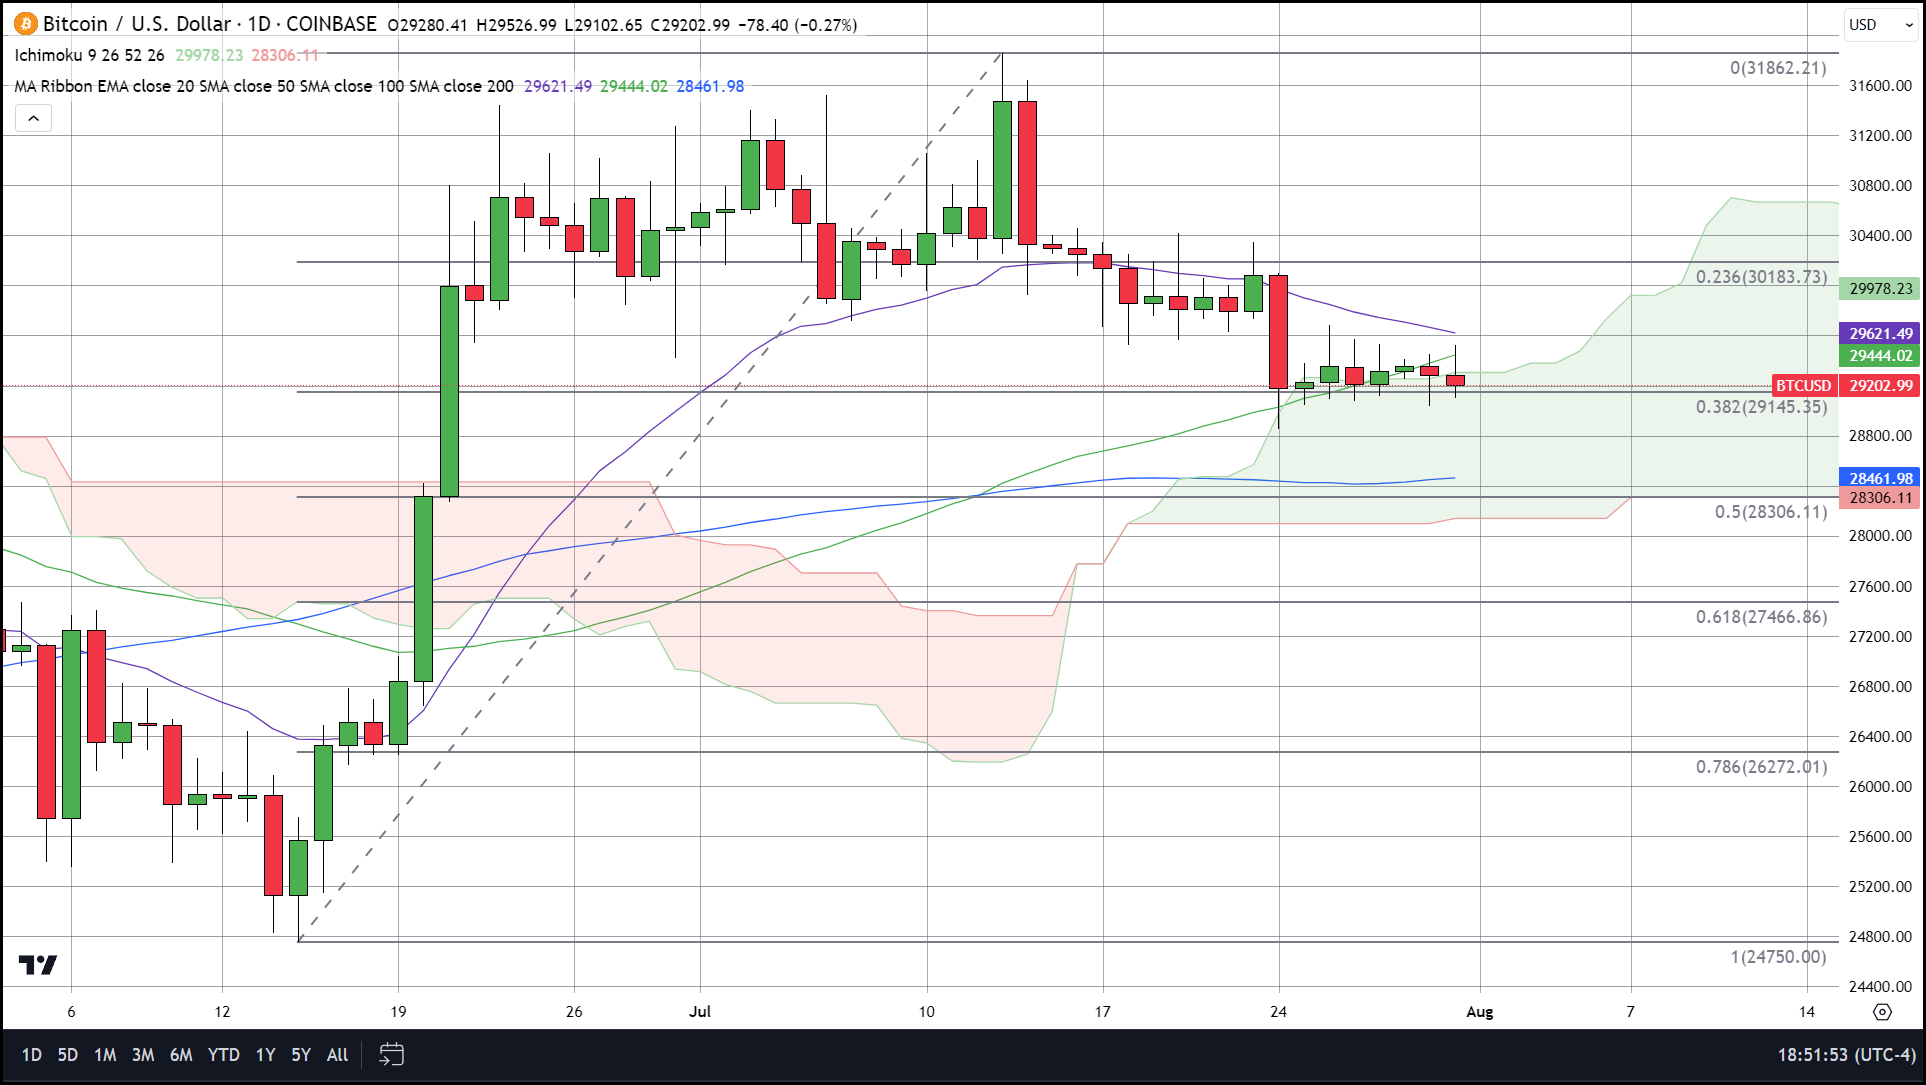
On a short-term daily candlestick chart with a simple Fibonacci retracement spanning from $24,750 up to $31,862, we can see that the 38% retracement level at $29,145 has been acting as support for the entire last week and the start of this one. This also matches up to the 50-day moving average and the top of our Ichimoku cloud. So, it is apparent that many technical indicators are confirming that the area right around $29,145 is a key level of support.
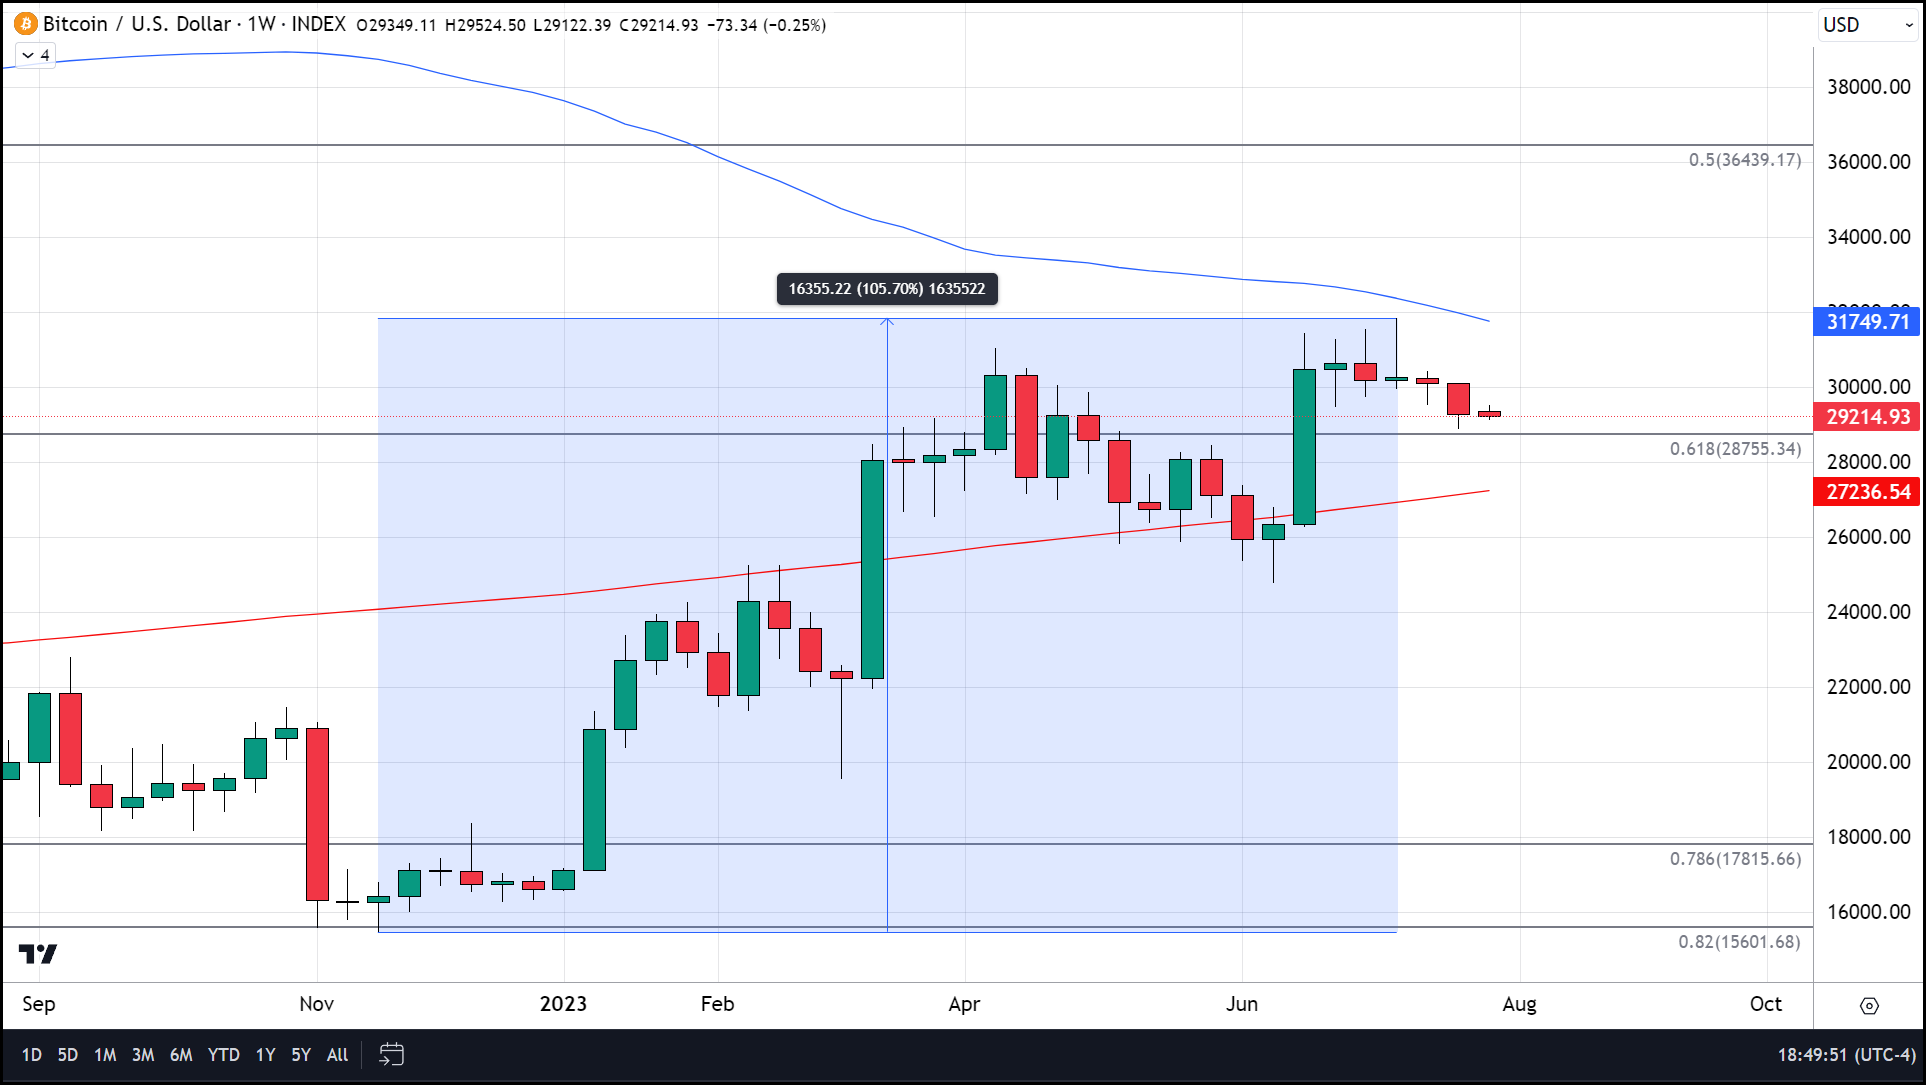
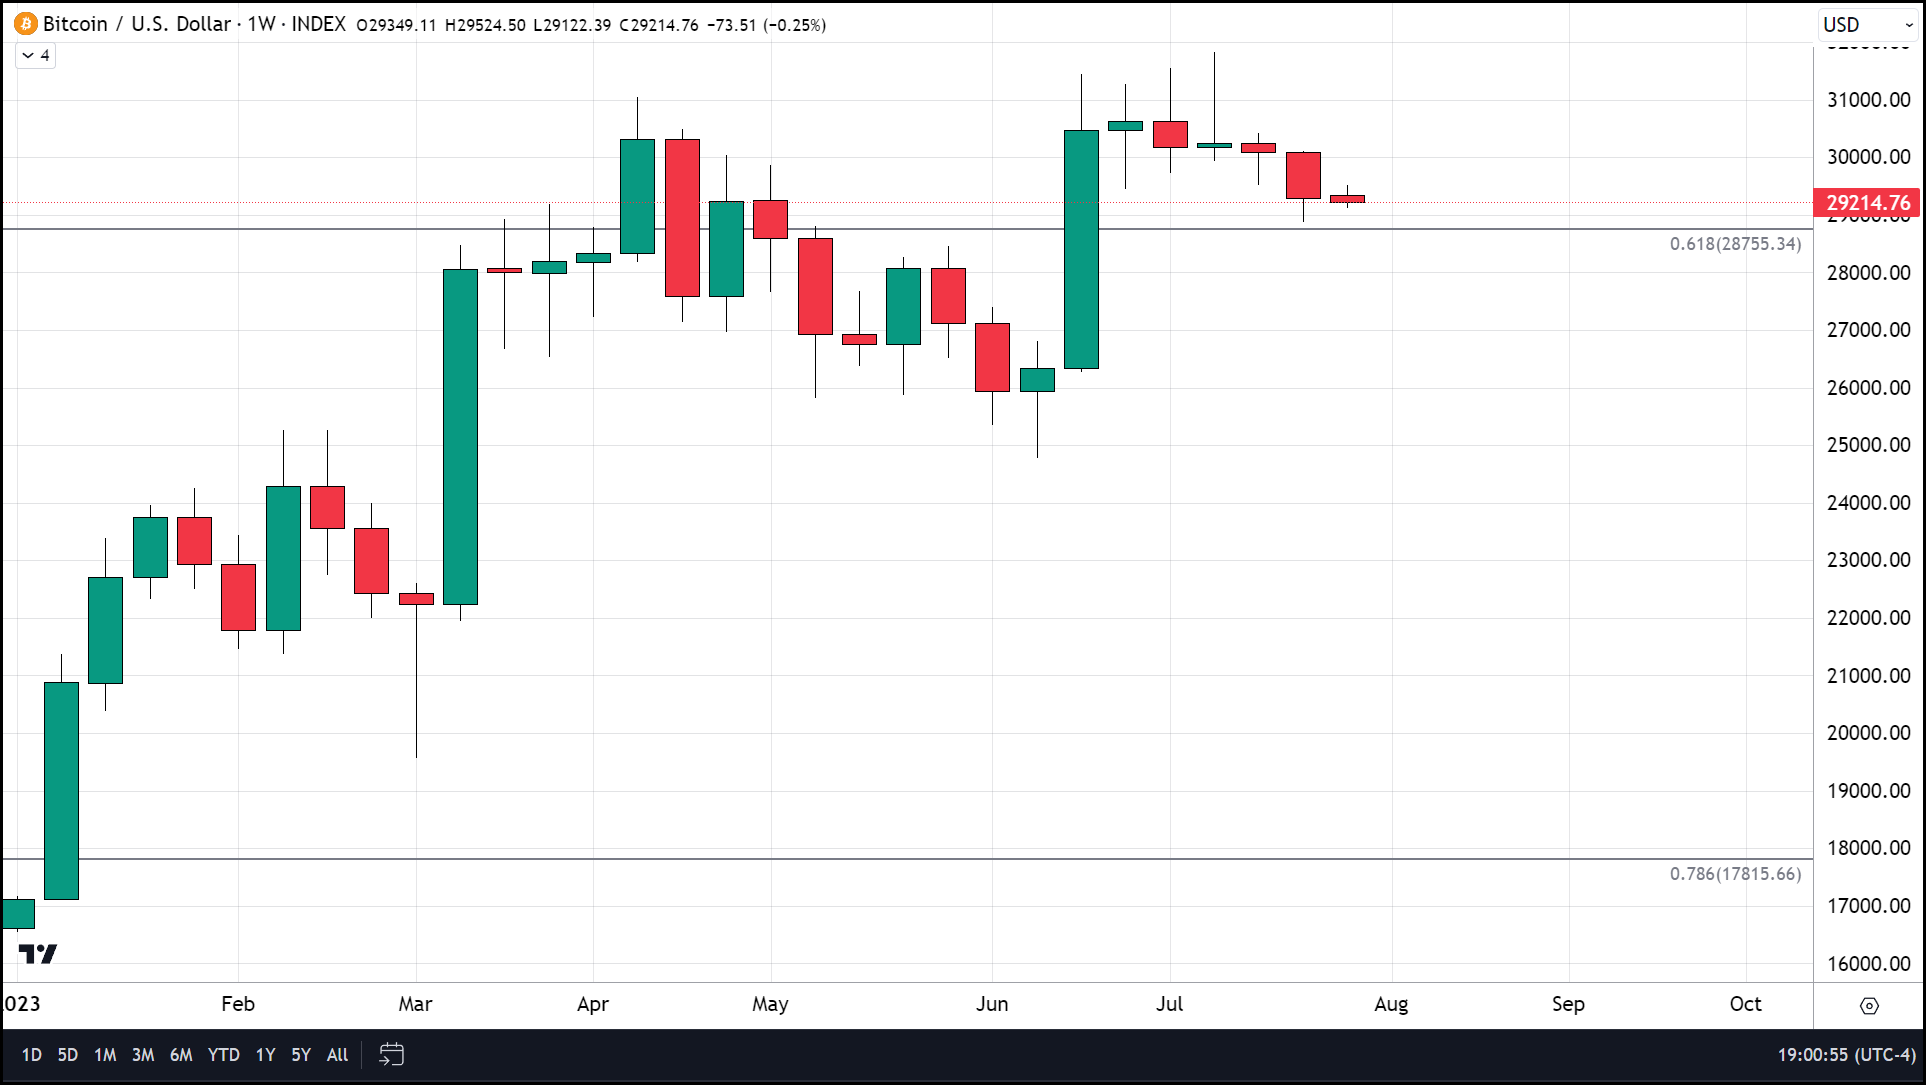
When we zoom out and look at a weekly candlestick chart, we can see that the current level of support has been in effect for going on 6 weeks. When we compress the chart even further, we see that this has been a key and critical level of support before.
Inserting a Fibonacci retracement that spans from the Covid crash of March 2020 up to the all-time high in November 2021 shows us that the 61.8% Fib. retracement level comes in at $28,755. This is only a few hundred dollars from the current level of support and the low that came in on Friday. Furthermore, this level matches up to the triple-bottom of May, June, and July of 2021.
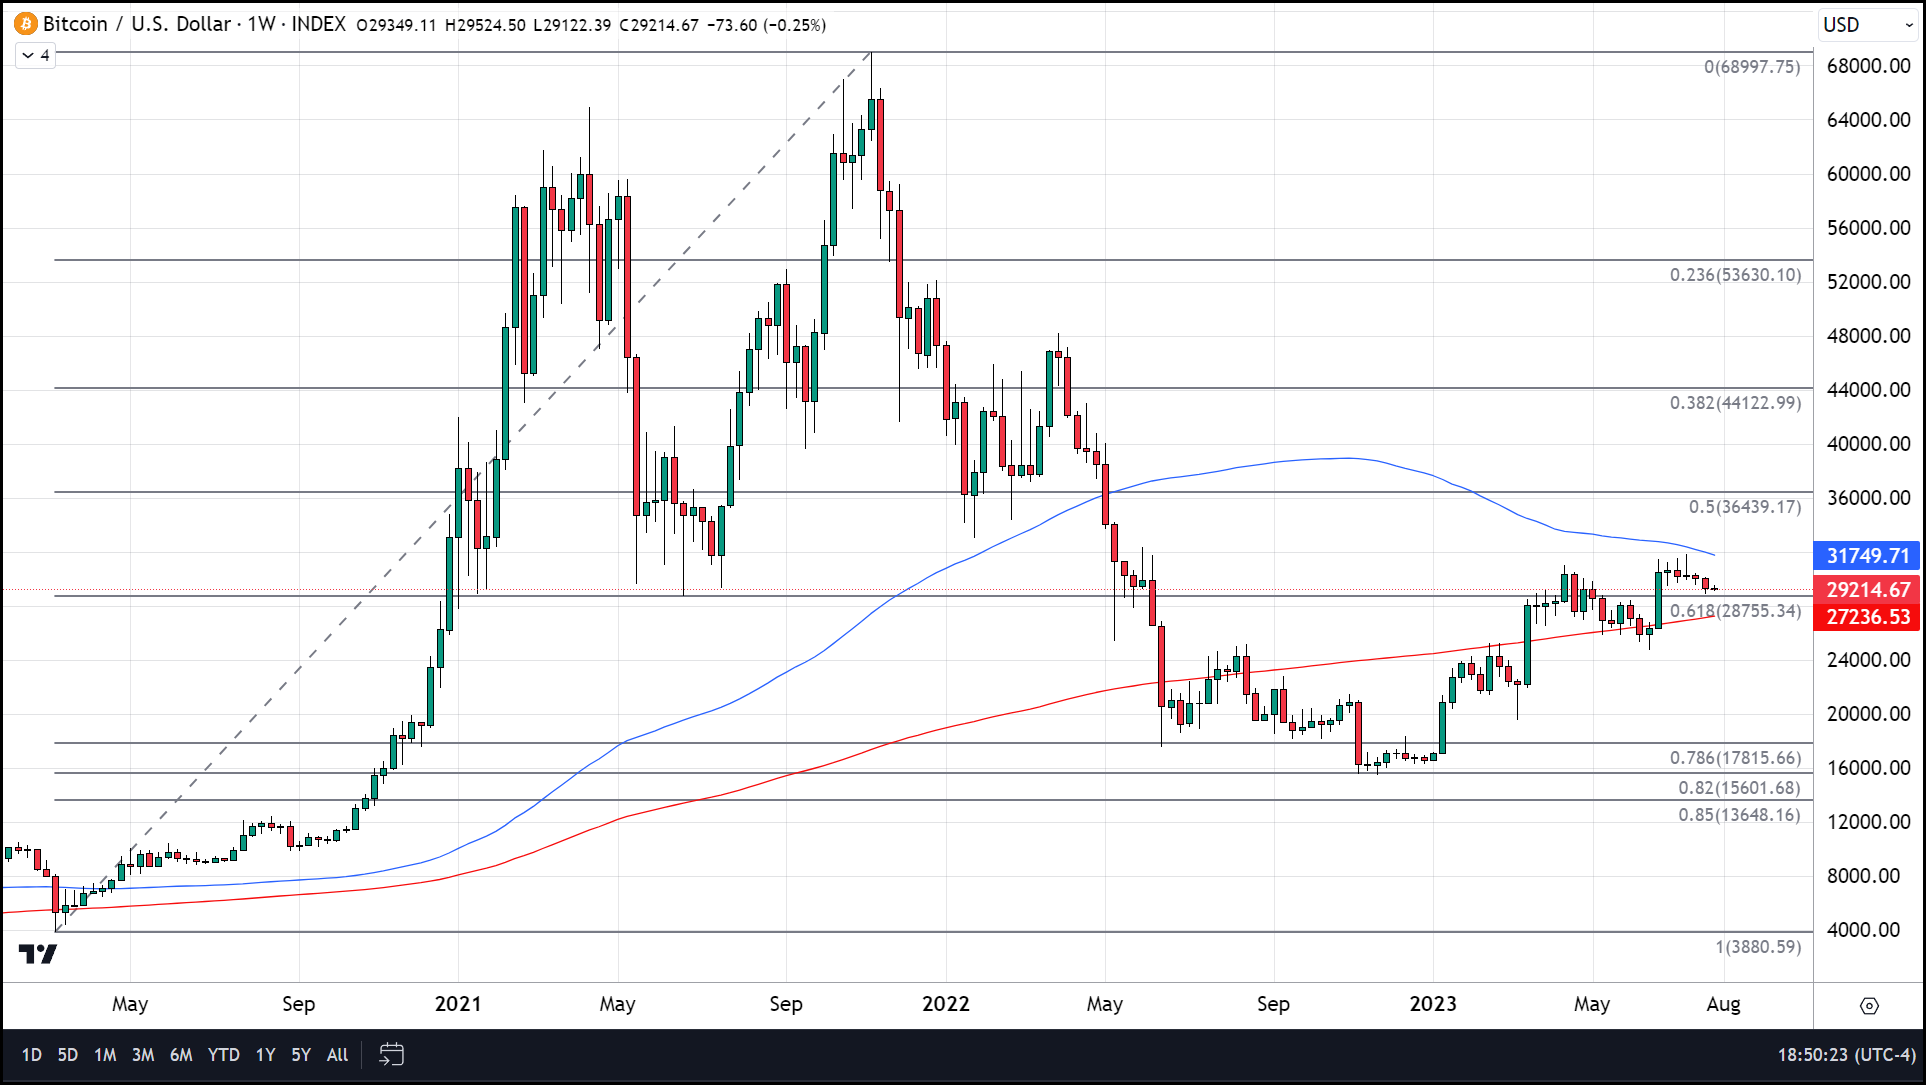
So, the current level of support in BTC is not a surprising one when we look back at the technical indicators. The one surprising thing is the low level of volatility seen in the market recently. The only time in recent history that Bitcoin has been so dormant for longer is the 8 weeks it spent at its recent bottom around $15-$17k and that turned out to be a launchpad that propelled prices 105% higher in only 33 weeks.