Bitcoin’s moving averages move into full bullish alignment

Bitcoin’s recent ascent has garnered it a lot of attention, especially since October 16th when the market moved substantially higher on a false report of a spot Bitcoin ETF approval. The fact that Bitcoin managed to hold on too much of its daily gains when the report was disproven tells us that traders who were not giving much credence to the idea that a spot ETF approval would move the markets substantially higher have joined the bandwagon of traders who do see the bullish influence of a spot ETF.
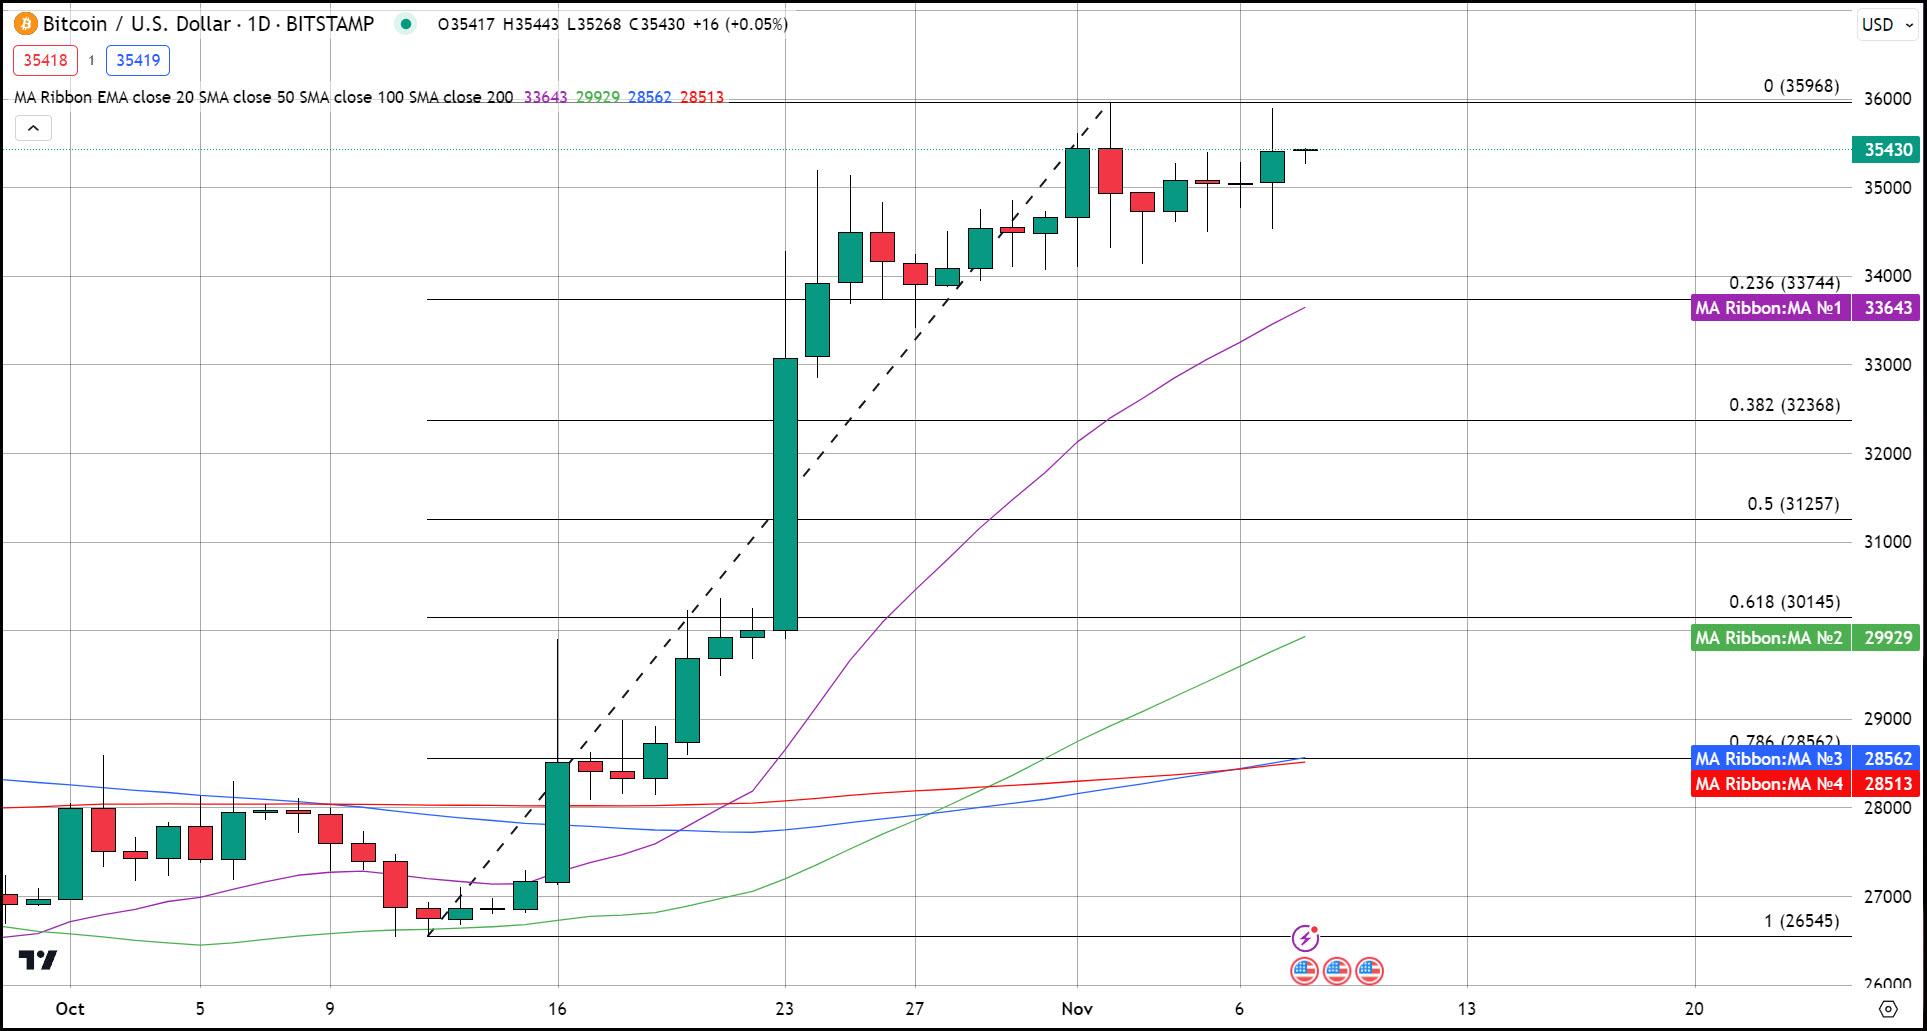
Bitcoin is closed on Tuesday with a gain of 1.06% ($372) right at the top of its range right below resistance at $35,415 (Bitstamp). Presently resistance in BTC remains at $35,500 with support at the 23.6% Fibonacci retracement level at $33,744. On November 7th an attempt was made to breach resistance but swiftly reversed its direction, marking the 14th day that Bitcoin has closed inside the range of $33,700 - $35,500.
Ever since Monday October the 16th when the false report was published, Bitcoin has remained above the 20-day exponential moving average. This moving average is in my opinion possibly the single most important technical study a trader has in their toolbox. By that I mean if I was forced to choose only one metric to make a conclusion of a market’s current short-term sentiment, the 20-day EMA would likely be my choice as it is surprisingly reactive for a lagging indicator of which all moving averages inherently are. Currently, the 20-day EMA is sitting just below the 23.6% Fibonacci retracement level (from $26,545 the bottom hit before current rally to $35,968 the recent high) this reinforces my belief that support is at this technical level. Bitcoin now sits roughly $1,770 above the 20-day EMA, and it would take a loss of over 5% to move it below this moving average.
All three of the major moving averages which consist of the 50,100 and 200-day simple moving averages are the most widely known and therefore most used moving averages by investors are painting an extremely bullish picture of Bitcoin. They approximate to 10, 20 and 40 weeks and analysts usually report when a bullish or bearish cross occurs. We just had that happen in Bitcoin, with the shorter-term 100-day moving above the longer-term 200-day. Because the shortest-term moving averages were already above them, it puts Bitcoin’s major moving averages in full bullish alignment.