Bitcoin's Short and Mid-Term Forecast

Short-term Forecast
On The 18th of July Bitcoin broke through support at the 20-day exponential moving average, the last time BTC closed below this moving average was in mid-June. The 20-day EMA is a very useful indicator that can accurately determine the current trend of a market. Simply put, if a market is above its 20-day EMA it is likely to move higher and if a market is below, it then a move lower is expected. Of course, this should be cross-referenced with other technical indicators as well as the current fundamentals to get the most accurate forecasts, but as a single indicator, it is one of the best tools at our disposal for determining the short-term bias of a market. Also taken out on the 18th was the 23% Fibonacci retracement level at $30,160. The next levels of our Fibonacci retracement spanning from $24,770 - $31,829 that could act as support include $29.1k (38%), $28.2k (50%), 27.4k (61%), and 26.2k (78%). Out of all these levels, the two that correlate with recent tops or bottoms and therefore are most likely to act as effective support are the 50% at $28,299 and the 78% at $26,281.
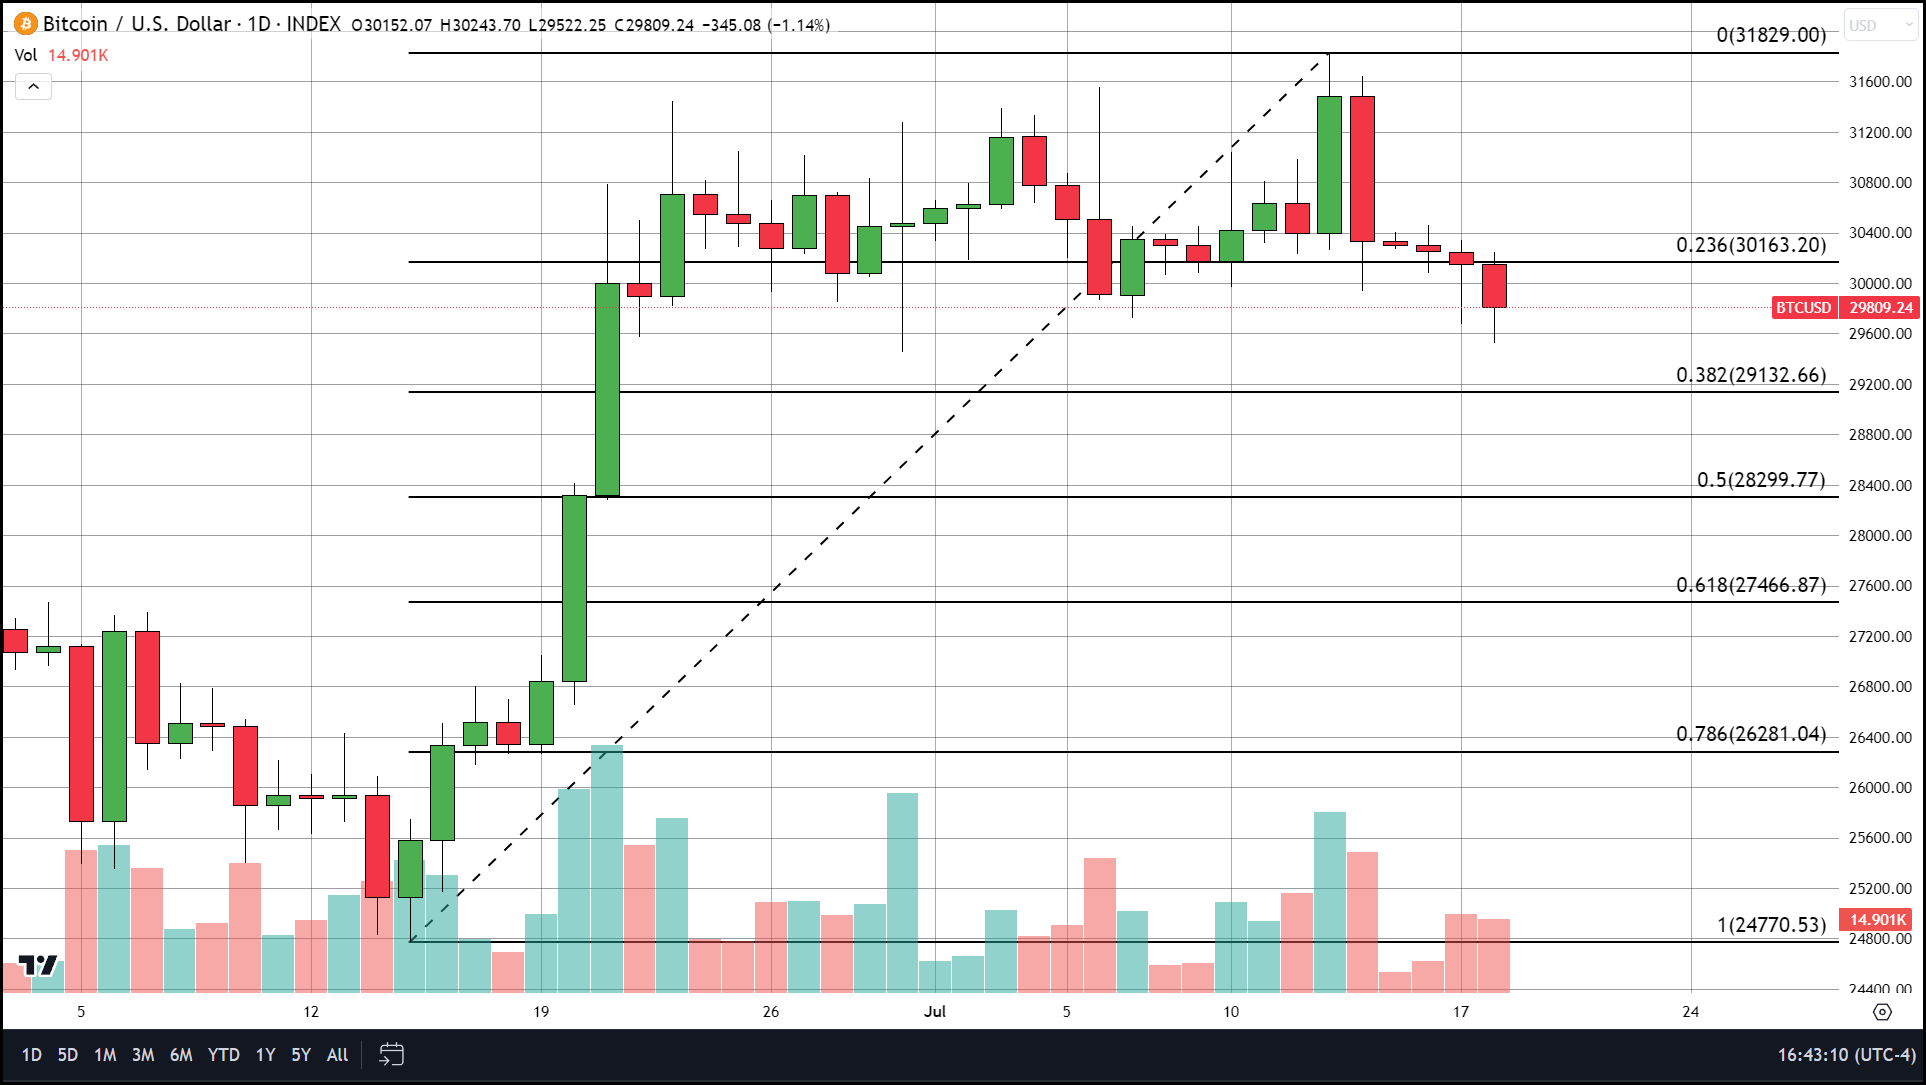
With the 20-day EMA and the 23% retracement taken out the question now becomes where could Bitcoin find support? To determine the most likely places BTC will visit we will utilize the visible range volume profile or VRVP. In our daily Bitcoin chart below that begins at the start of 2023 the VRVP tells us that the price point with the most volume traded at for 2023 is $28,000. This closely matches the 50% retracement, therefore $28,000 is a price we will likely see Bitcoin trade to this week and the most likely target for BTC if it continues its decline which our technical indicators predict is highly probable.

Mid-Term Prospects
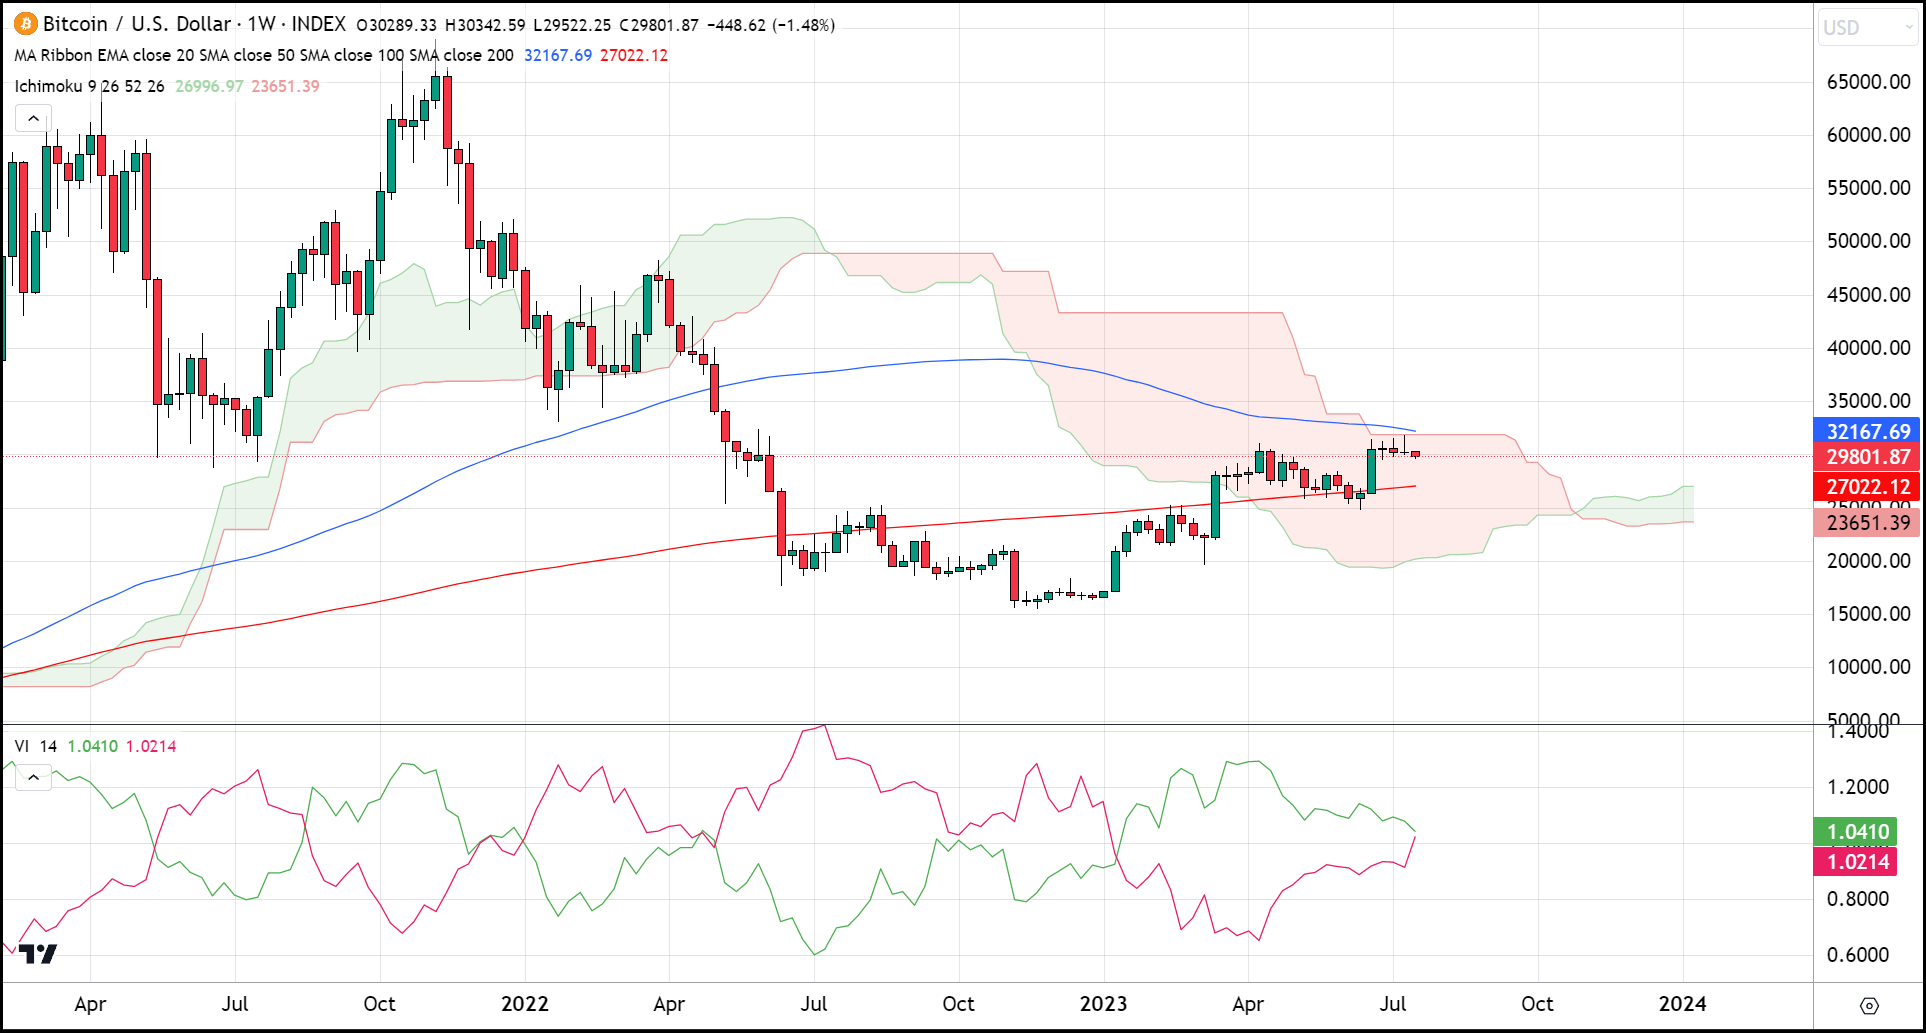
For our mid-term forecast, we will utilize the vortex indicator, Ichimoku clouds, and moving averages on a weekly chart.
The vortex indicator is a great tool for showing pivots in a market as well as the current trend direction. Tradingview says this about the vortex indicator “Uptrends, or buy signals, occur when the VI+ line is below the VI- line and then crosses above the VI- to be the top trendline. Downtrends, or sell signals, occur when the VI- line is below the VI+ line and then crosses above the VI+ to be the top trendline. It is a general rule that whichever trendline is on top usually is the one which dictates a security’s position (being either in uptrend or downtrend). ” In our chart, the VI+ is shown in green and the VI- in red.
Although we have not yet gotten a cross of VI- moving above VI+ the chart shows we are extremely close to just that.
The Ichimoku cloud formation tells us a few things. First that BTC has been in a transitional phase since the week of March 20th. Secondly, with the leading span a above leading span b (the two lines that form the cloud), it is predicted that the move outside of the current cloud will be to the upside. Lastly and most importantly it is confirming the strong resistance around $32,000. In fact, the highest price BTC has hit in 2023 which occurred at last week’s intra-week high of $31,829 matched up precisely with the top of the cloud Bitcoin has been enveloped in since the end of March. The 100-week moving average also lies at around $32k so not only is this the price point the bulls need to take out but if they do take the price above $32k on a closing basis it would likely signal that the price would likely move much higher after that breach of the $32k resistance level.
Conclusion
So, to summarize, the likely short-term direction will continue to be to the downside at least until $28k with 26k also being a likely target. The mid-term direction is not as clear cut as some indicators show a conflicting directional bias, the one thing that is however clear cut in our studies is that a clean break above $32,000 will likely result in Bitcoin moving much higher in a swift manner.