BTC losses the line of scrimmage (the 200-week SMA)

Bitcoin is on third down at the 9th yard line, 4 points behind the challengers (team FUD) at the fifth edition of the new world currency wars. The goal line is represented by Bitcoin’s 200-week simple moving average. The simple fact is that all Western Traders would agree that a market of any sort trading above its 200-day simple moving average was indeed in a long-term bullish trend, i.e. in a bull market.
Bitcoin held the title of defending champions four years running, holding onto the 200-day SMA. However, the Federal Reserve put an end to BTC’s streak of wins by creating (by failing to act in a timely manner) conditions ripe for large scale inflation. This led to the Fed pulling out its secret weapon of interest rate hikes. Now with no cheap money available combined with the sharp increase in the cost of necessities bled retail investors (especially younger traders) too dry to invest in what they still see as having huge potential for future growth.
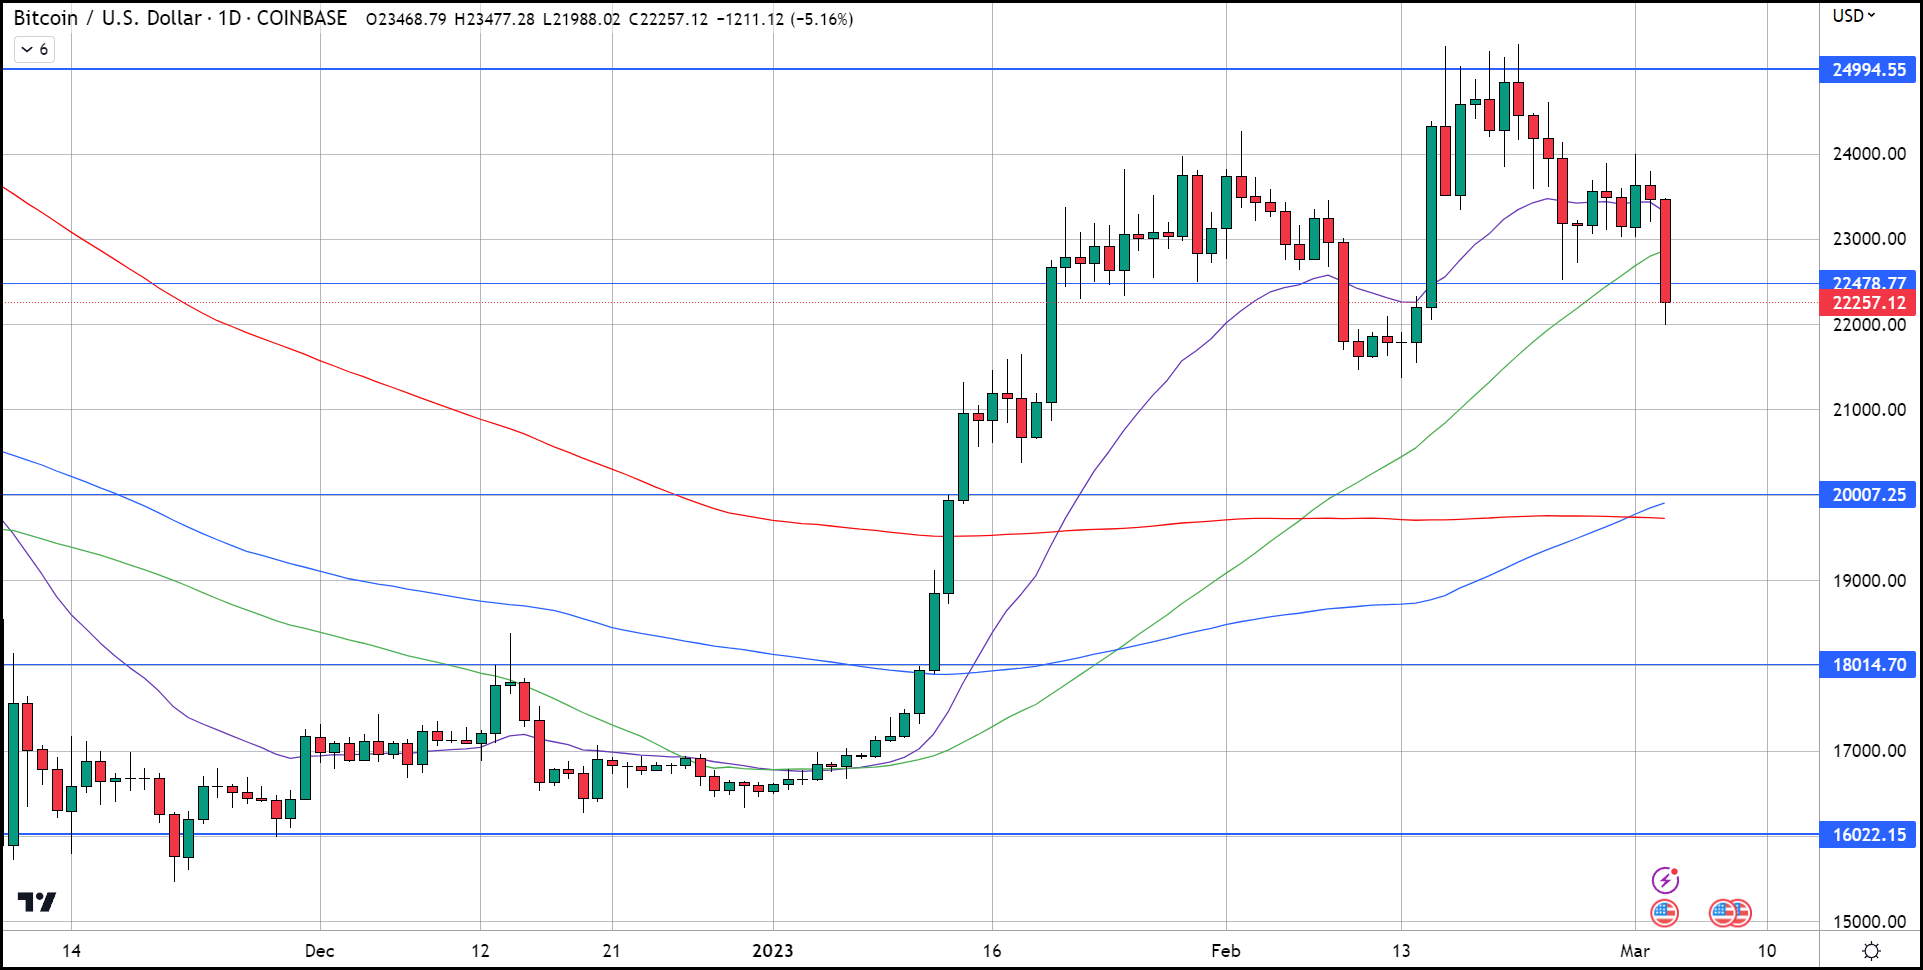
As of 5 PM EST Bitcoin is trading down by over $1,200 or 5.19% on the day, and 5.55% on the week. On a weekly candlestick chart, you can see the Bitcoin topped out at $25,000 which coincides with the all-important 200-week SMA, and formed a doji candle between $25k resistance and what was it’s first level of support at $22k.
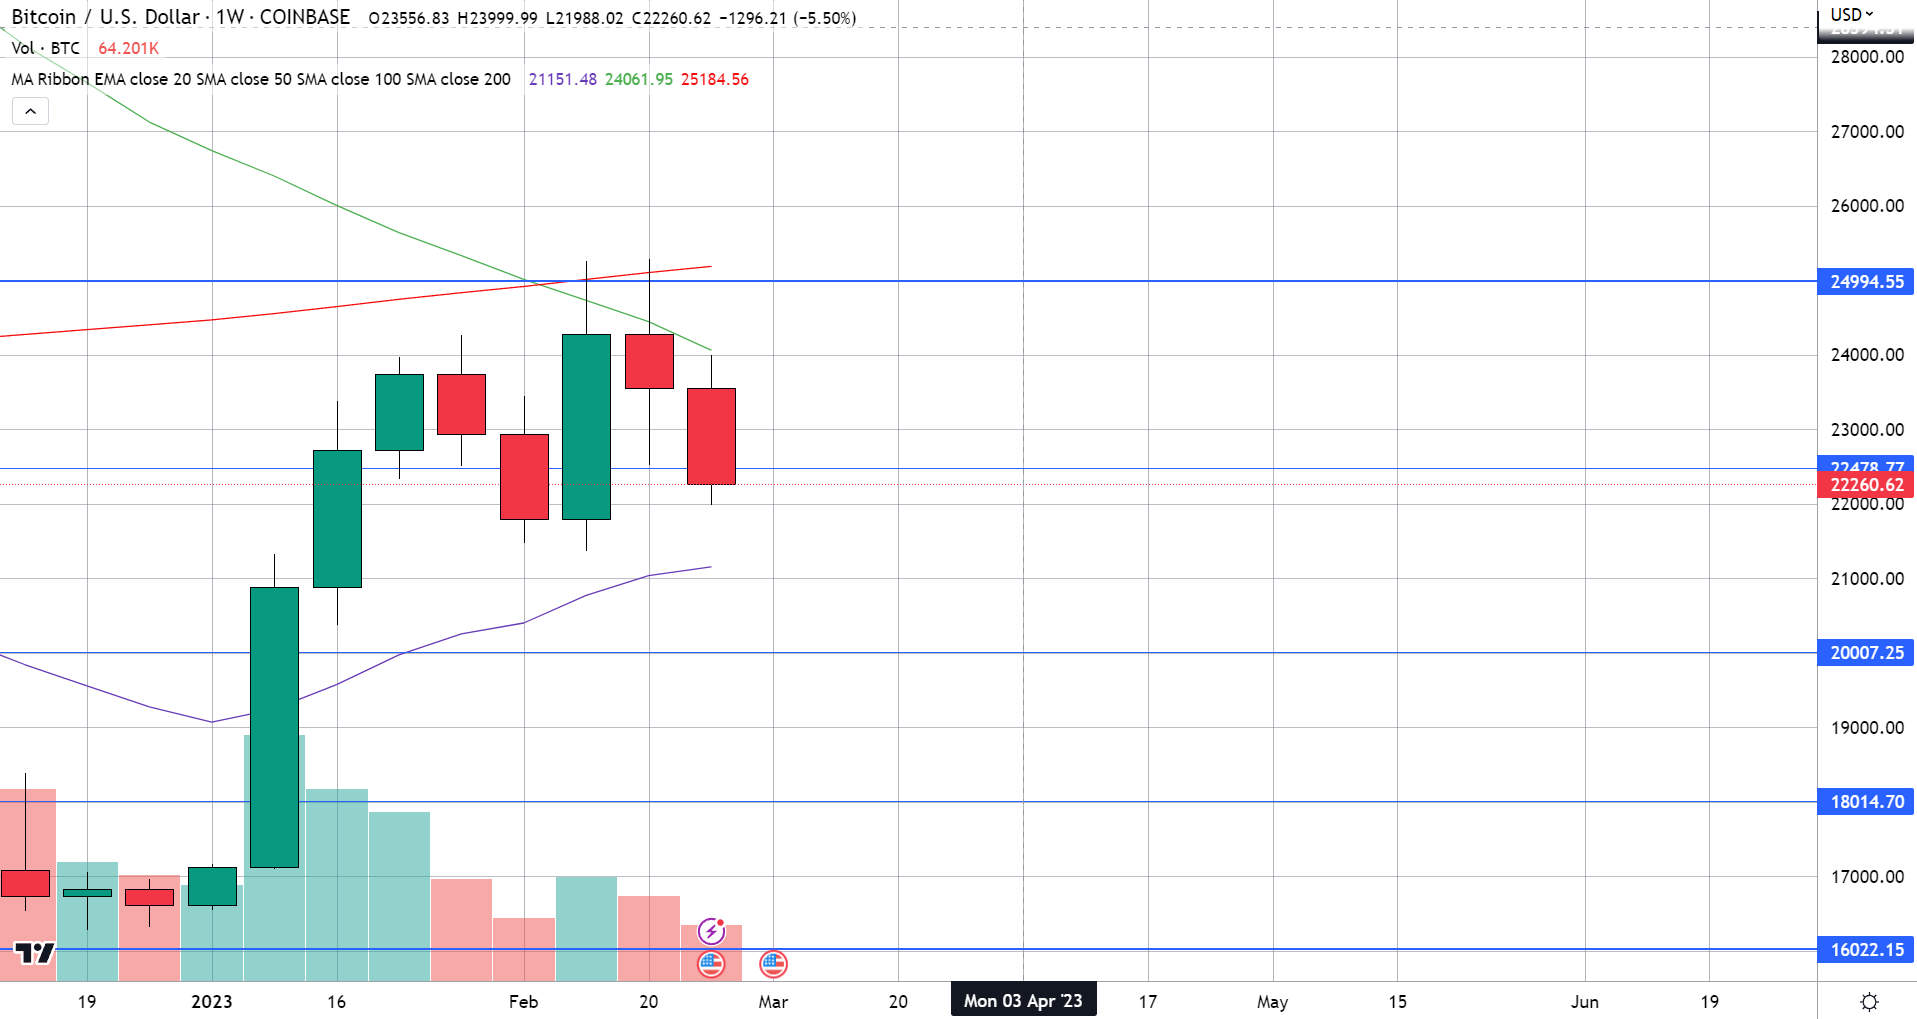
This week’s candle confirmed the pivot back to a bearish trend, this week we didn’t even come close to testing the 200-week SMA and spent the entire week below the 50-week SMA. Today’s losses brought us below the $22k support, with the next levels at $20k and $18k. It also brought the entire crypto market cap back below $1 trillion.
So, it seems BTC has given up the ball and looks destined to lose this year’s game at the line of scrimmage, the 200-week moving average.