If you think history repeats itself than you assume Bitcoin’s rally has just begun
Most people that have any knowledge of Bitcoin and cryptocurrencies in general understand the concept of what a “halving” is. Halving refers to an event in which all the new coins produced on a blockchain are cut in half. Although Bitcoin is not the only cryptocurrency to have a massive deflationary aspect in its code, but it did indeed invent this idea of a halving mechanism. Some of the early proof-of-work algorithm “copycat” coins did employ some sort of “halving” or a reduction of output overtime none did it quite like Bitcoin and soon most coins would abandon this cornerstone of BTC.
Most traders also know that the halving tends to cause a run up in prices, if we look back to price action around each of the three previous halving events (2012, 2016, 2020) price bottoms formed roughly one year prior to each event. Other than the March 2020 crash brought on by a pandemic Bitcoin has begun its rallies a year prior to each halving. This time is no different.

With the halving roughly 340 days away this long-awaited event will likely thaw any traces of winter still left and although Bitcoin has seen a resurgence in dominance, the halving will likely prop up all the other coins riding BTC’s coattails. We will be watching the markets closely and make sure to let our followers know when they need to be long.
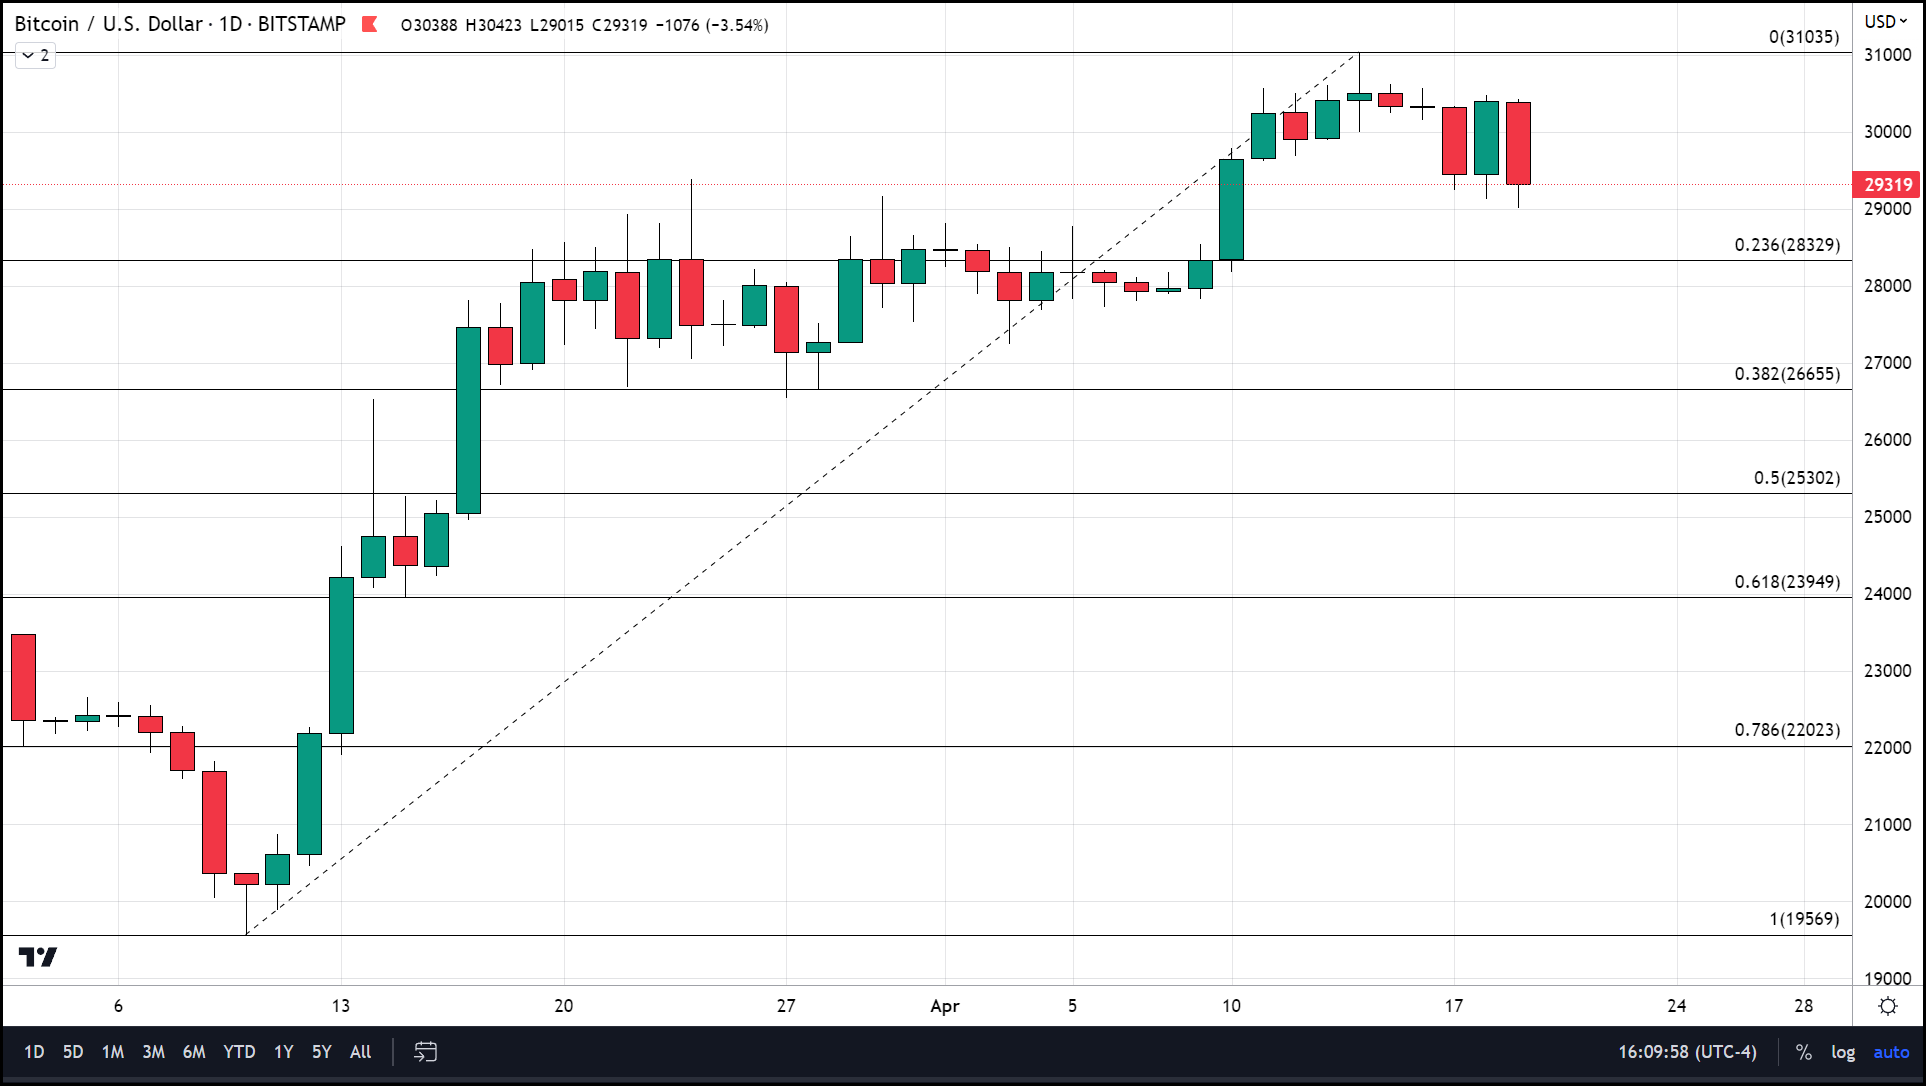
In the short-term however Bitcoin seems primed for a retracement after hitting resistance at $30,500 for the last three days and BTC has had lower lows for the last five days. There are three areas of support that we want to watch for a bounce should Bitcoin revisit them. The first area of support was an area of strong resistance for the end of March and beginning of April until we finally broke above it Last Monday April 10th and that is at $28,500. The next level was support for the same period and resides at $26,650 and below that is $25,000. All three of these levels also represent retracement levels from the March low of $19,000 to the recent highs above $30,000. They make up the 23.6% and the 38,2% Fibonacci retracement levels and $25,000 represents a 50% retracement.