Tentative buy signal in BTC
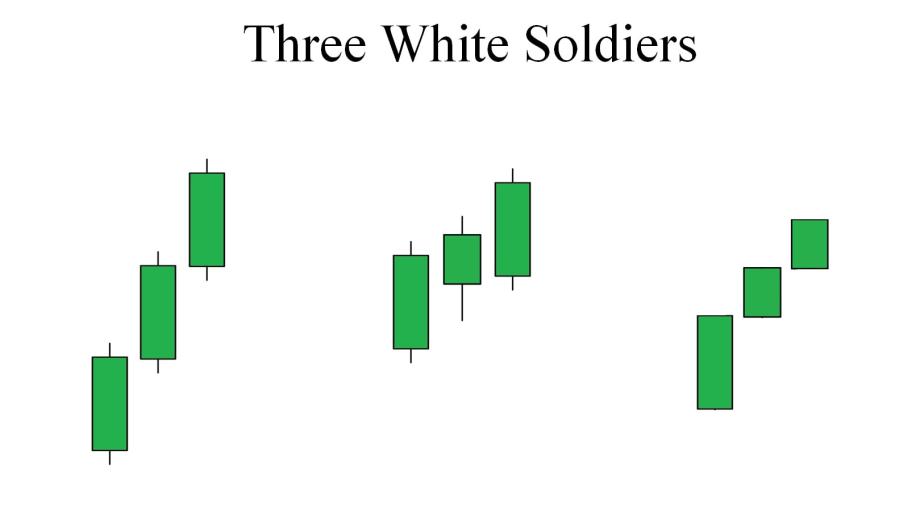
Today we got a weak example of a three-day candlestick pattern known as “three white soldiers” appearing in the daily candlestick chart for Bitcoin. I say weak because while it does meet most of the criteria which is;
Three long and green candlesticks in a row.
Appearing after a defined downtrend.
Each of those candles must open above the previous day’s open.
Each candle must open progressively upward, establishing a new short-term high.
The candles should have very small (or nonexistent) upper shadows/wicks.
The last three days fall short of the last milestone as all three daily candles contain long upper wicks. Other indicators that are used in conjunction to confirm this pattern are also split between strengthening and non-validation. One confluent indicator that gives this pattern strength is the RSI which is well below the upper band of 70, currently residing at around 50. The technical indicator that takes strength away from this current pattern is the low trading volume, alternatively high volume at the time this pattern is formed helps to strengthen the likelihood that the forecasted reversal is in play.
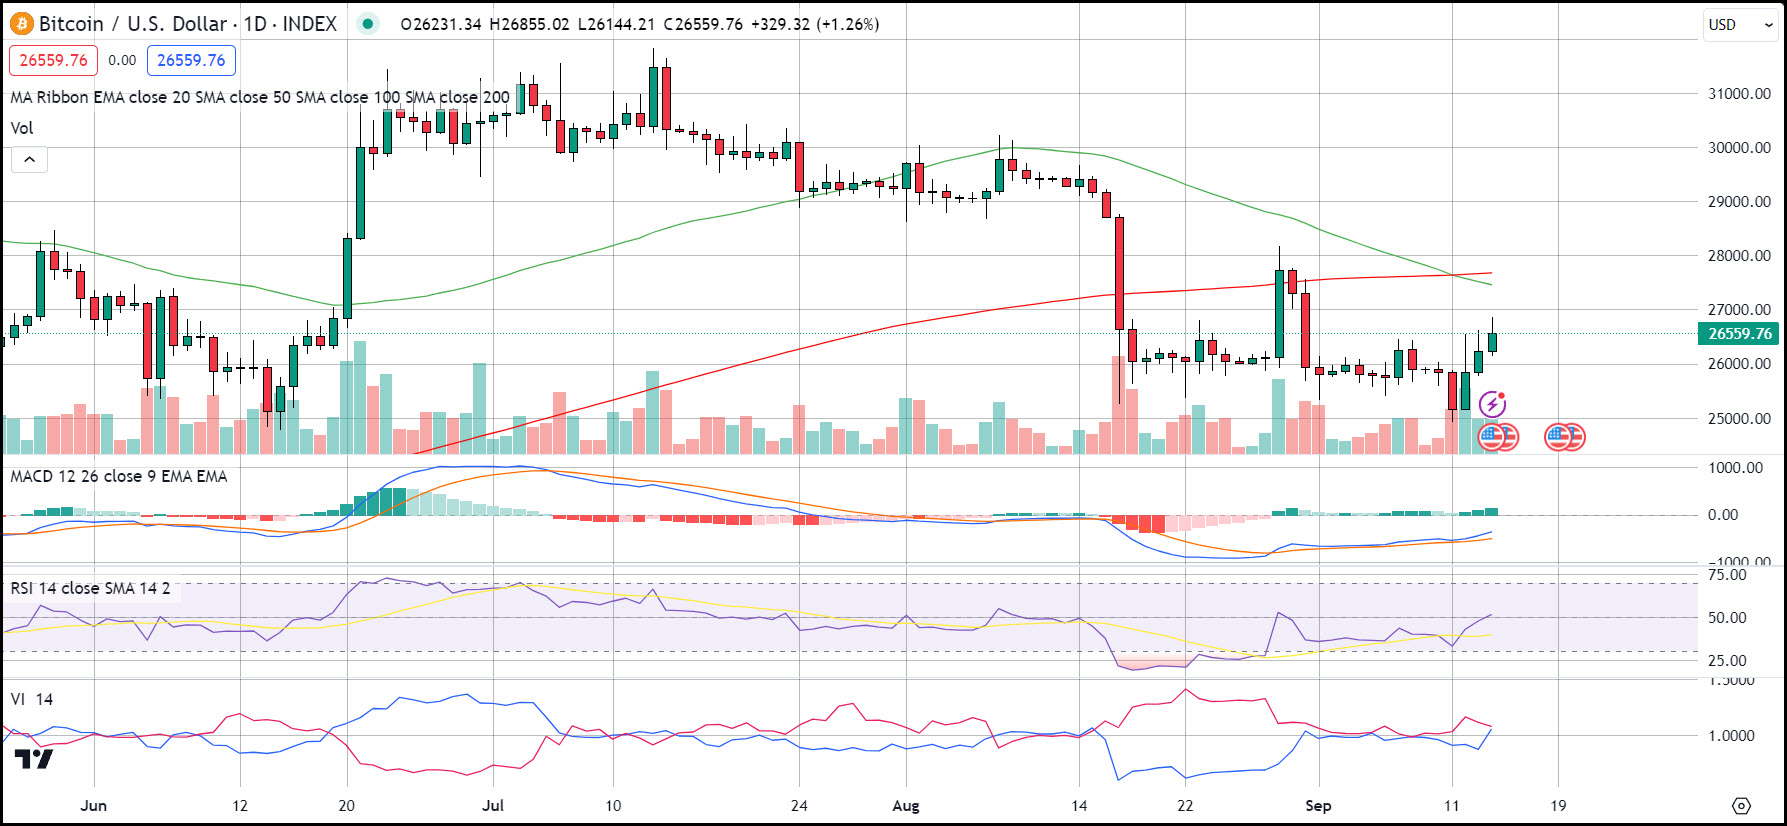
We would also like to see a highly bullish MACD which is not the case, as the MACD is only slightly bullish in its current form. One more technical study that I like to use in my trades the vortex indicator, is poised to call for an upside swing (whenever the blue line crosses over the red line in our chart) it has yet to complete this formation.
So, while it is tempting to issue a buy signal today, we will remain on the sidelines and not issue a buy signal until further confirmation is acquired.