Bitcoin scores second monthly close above $65,000 But 1st my recent talk with David Lin

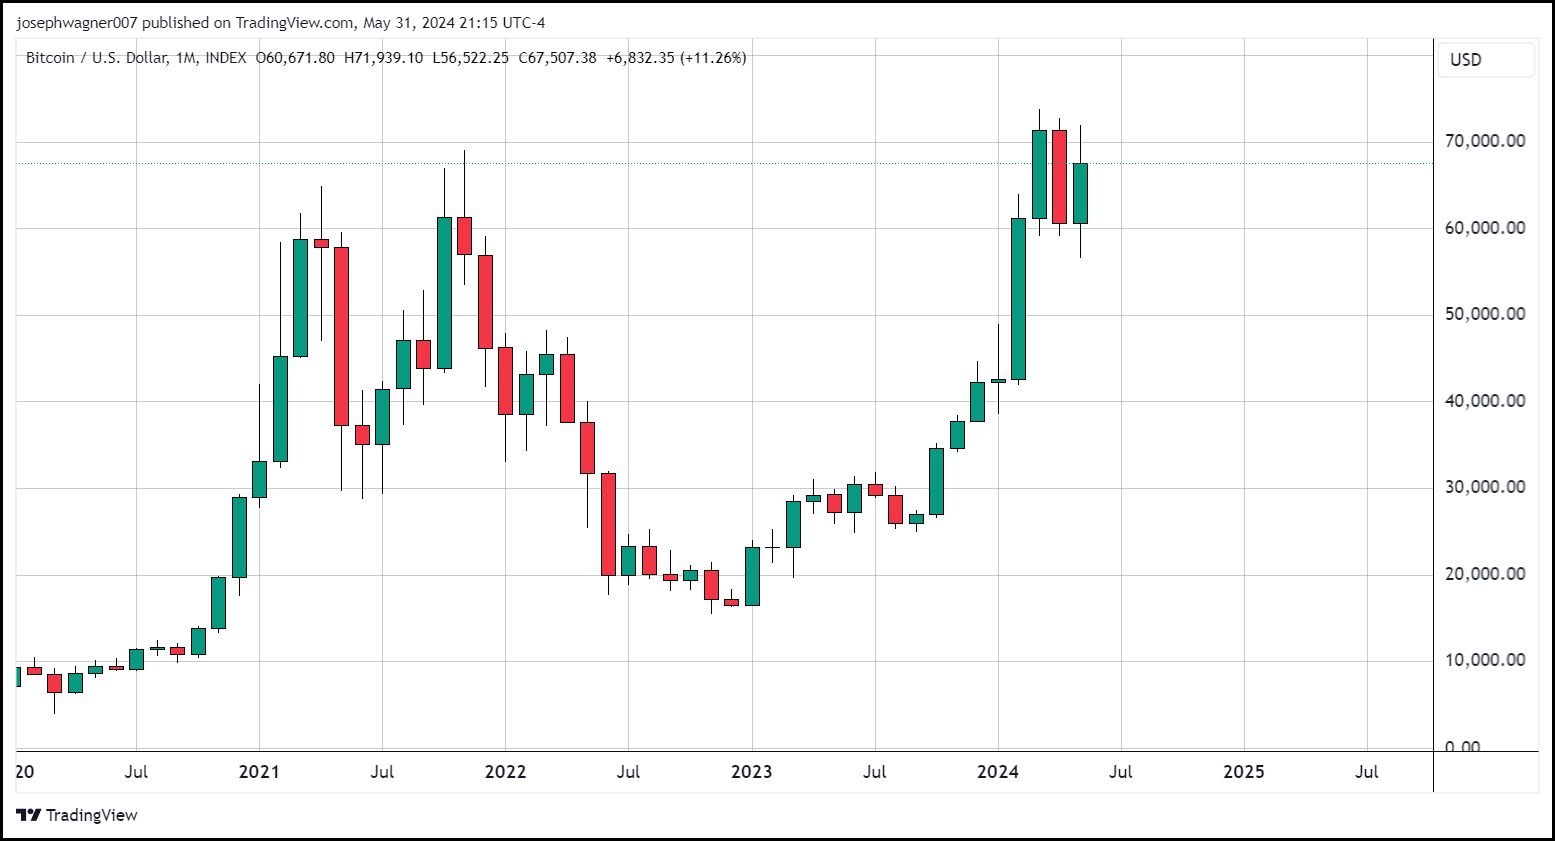
Bitcoin had its second monthly close above $65,000 ending May 11.28% higher. The month-to-month gain comes after the world’s largest cryptocurrency posted a nearly 15% decline for April 2024. The sizable green monthly candle paints a picture that is not as bullish as one might assume once you take into account the upper and lower shadows or wicks.
Wicks on a Japanese candlestick chart form when the price extends above or below the opening or closing price. On a monthly chart this simply means that in the case of a green candle (higher open compared to close) the price this month was at one point much higher than the close and much lower than the open, or start of the month. With long upper and lower wicks, this month’s candle suggests that the bulls were in control of pricing although at some point the bears took control. The placement of the wicks is another indication of downside pressure. The last three months all began right around $60,000 however the highs achieved have been consecutively lower along with this month’s low reached prices not seen since February.
The picture painted is far different when switching to a daily candlestick chart. The last 90-days have been mostly absent of volatility usually contained in Bitcoin, as BTC remained range bound for the majority of the last three months between $70,000 and $60,000. Also, showing neutral bias is the 14-day RSI, currently set at 52, and the MACD, which is printing near zero.
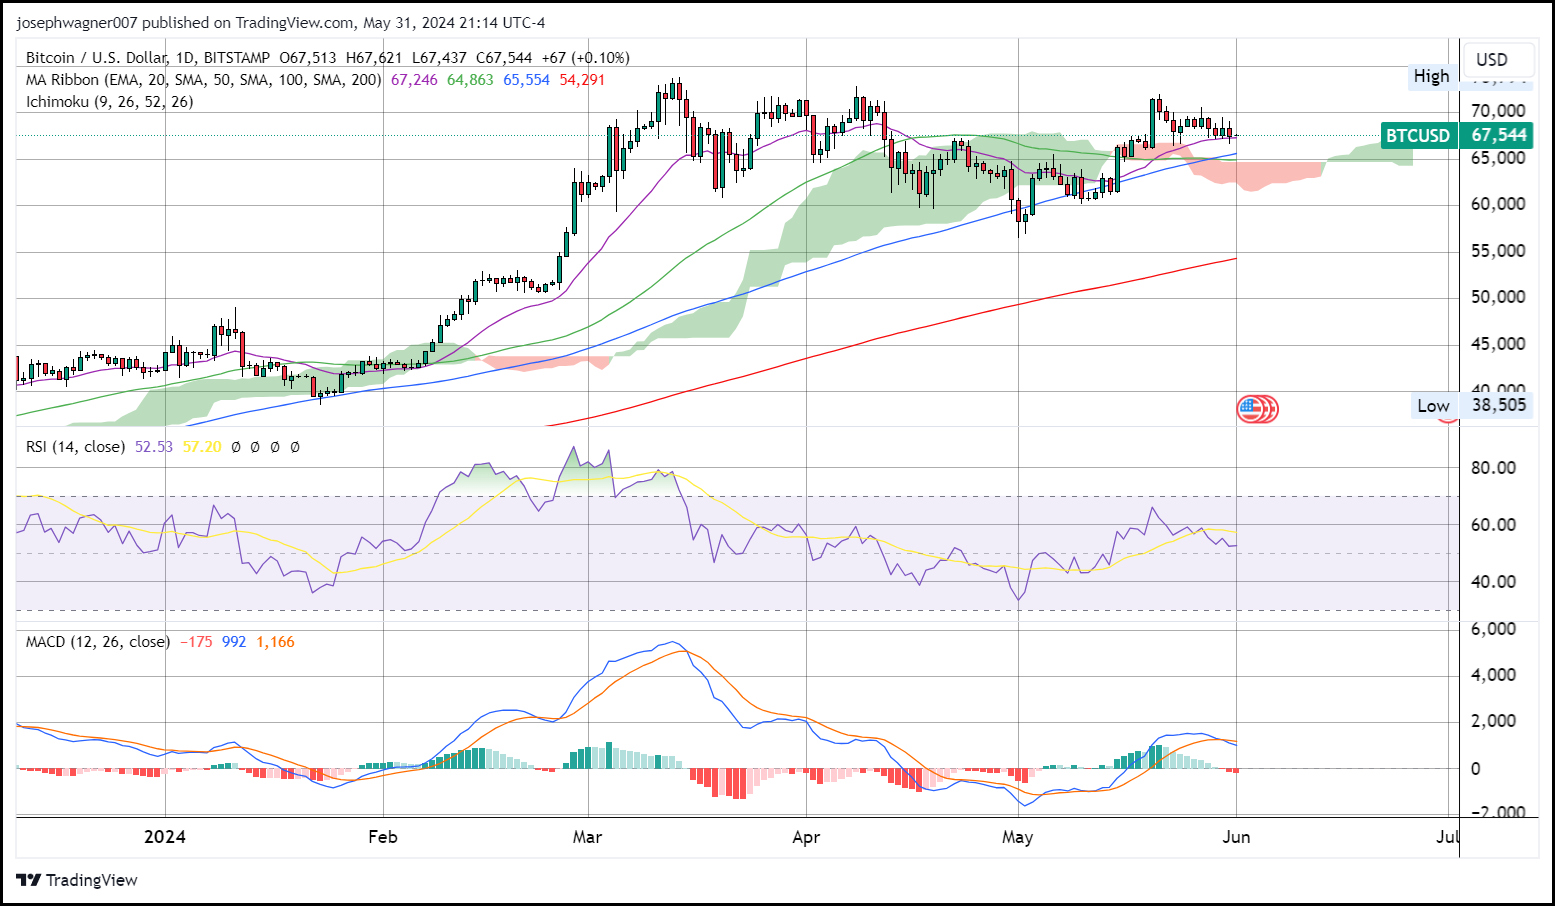
The moving averages are also neutral, neither favoring bulls nor bears. While the price is firmly above the short-term 50-day simple moving average, the 100-day simple moving average moved above that this week, creating what is known as a bearish cross. For the last 90 days, Bitcoin has spent around the same amount of time above and below the 20-day exponential moving average. It currently is sitting right above that short-term moving average, which is usually indicative of a market in an uptrend. However, if Bitcoin drops another $500, it will signal a break below the 20-day EMA and probably usher in a revisit of the next support level at $62,000.