Bitcoin and gold trading in tandem?

The world’s favorite Cryptocurrency and the world’s favorite metal rarely move in synch. If anything, the two are known for having a negative correlation. But when looking at both markets’ historical price action, I found a relationship that is not so black and white.

At the start of BTC futures trading (December 2017), Bitcoin fell hard and fast from its recently achieved record high of $20,000 down to about $7,000 by the start of February. At the same time, gold rallied from $1,240 up to $1,360. Over the next two years, this negative correlation can be seen as one asset would make a new high the other would be hitting a bottom. However, this all changed when the pandemic started.
In March of 2020, when covid officially became a global pandemic rather than a regional epidemic, both gold and Bitcoin experienced a flash crash. Gold went from trading at $1660 on March 9th, 2020, to a low of $1480 only ten days later. BTC futures were priced around $9,500 on March 5th, 2020, a low of $4,500 11 days later.
From that moment until now, the relationship between gold and bitcoin prices has matured into something new. Could one find instances where the price of one market would be at a top while the other was at a bottom? Yes, but there is more to it than that.
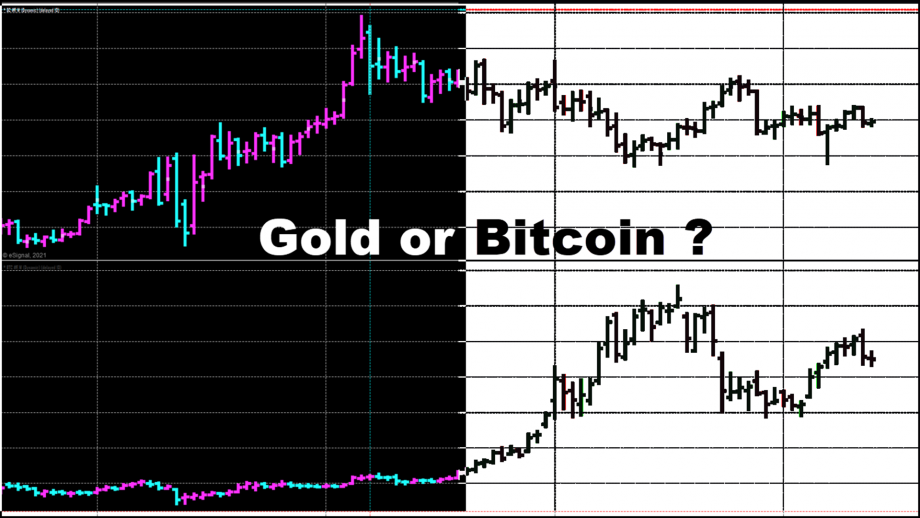
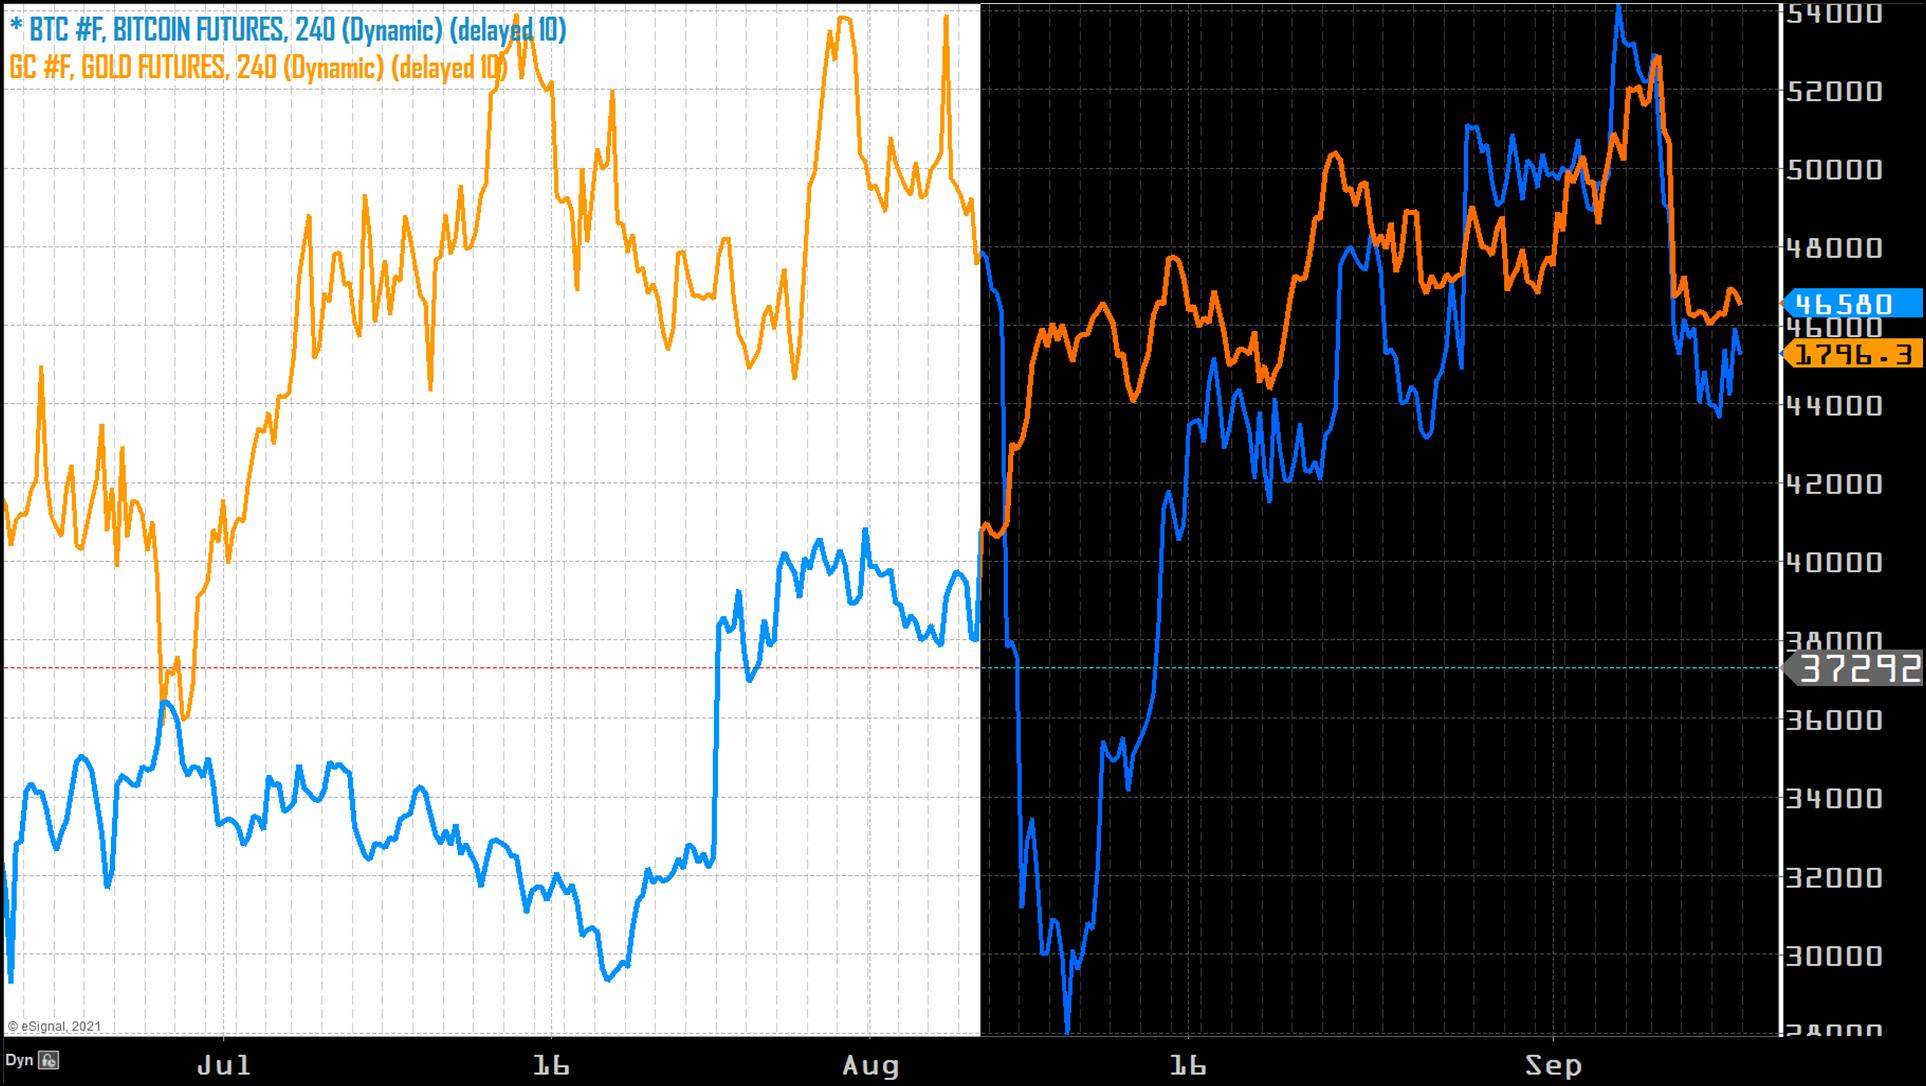
While looking at overlayed charts of gold and Bitcoin futures, it is pretty clear that gold recovered from the crash in March much faster than Bitcoin did. In fact, gold hit its all-time high ($2,088) precisely four months before BTC hit its record high ($60,000).

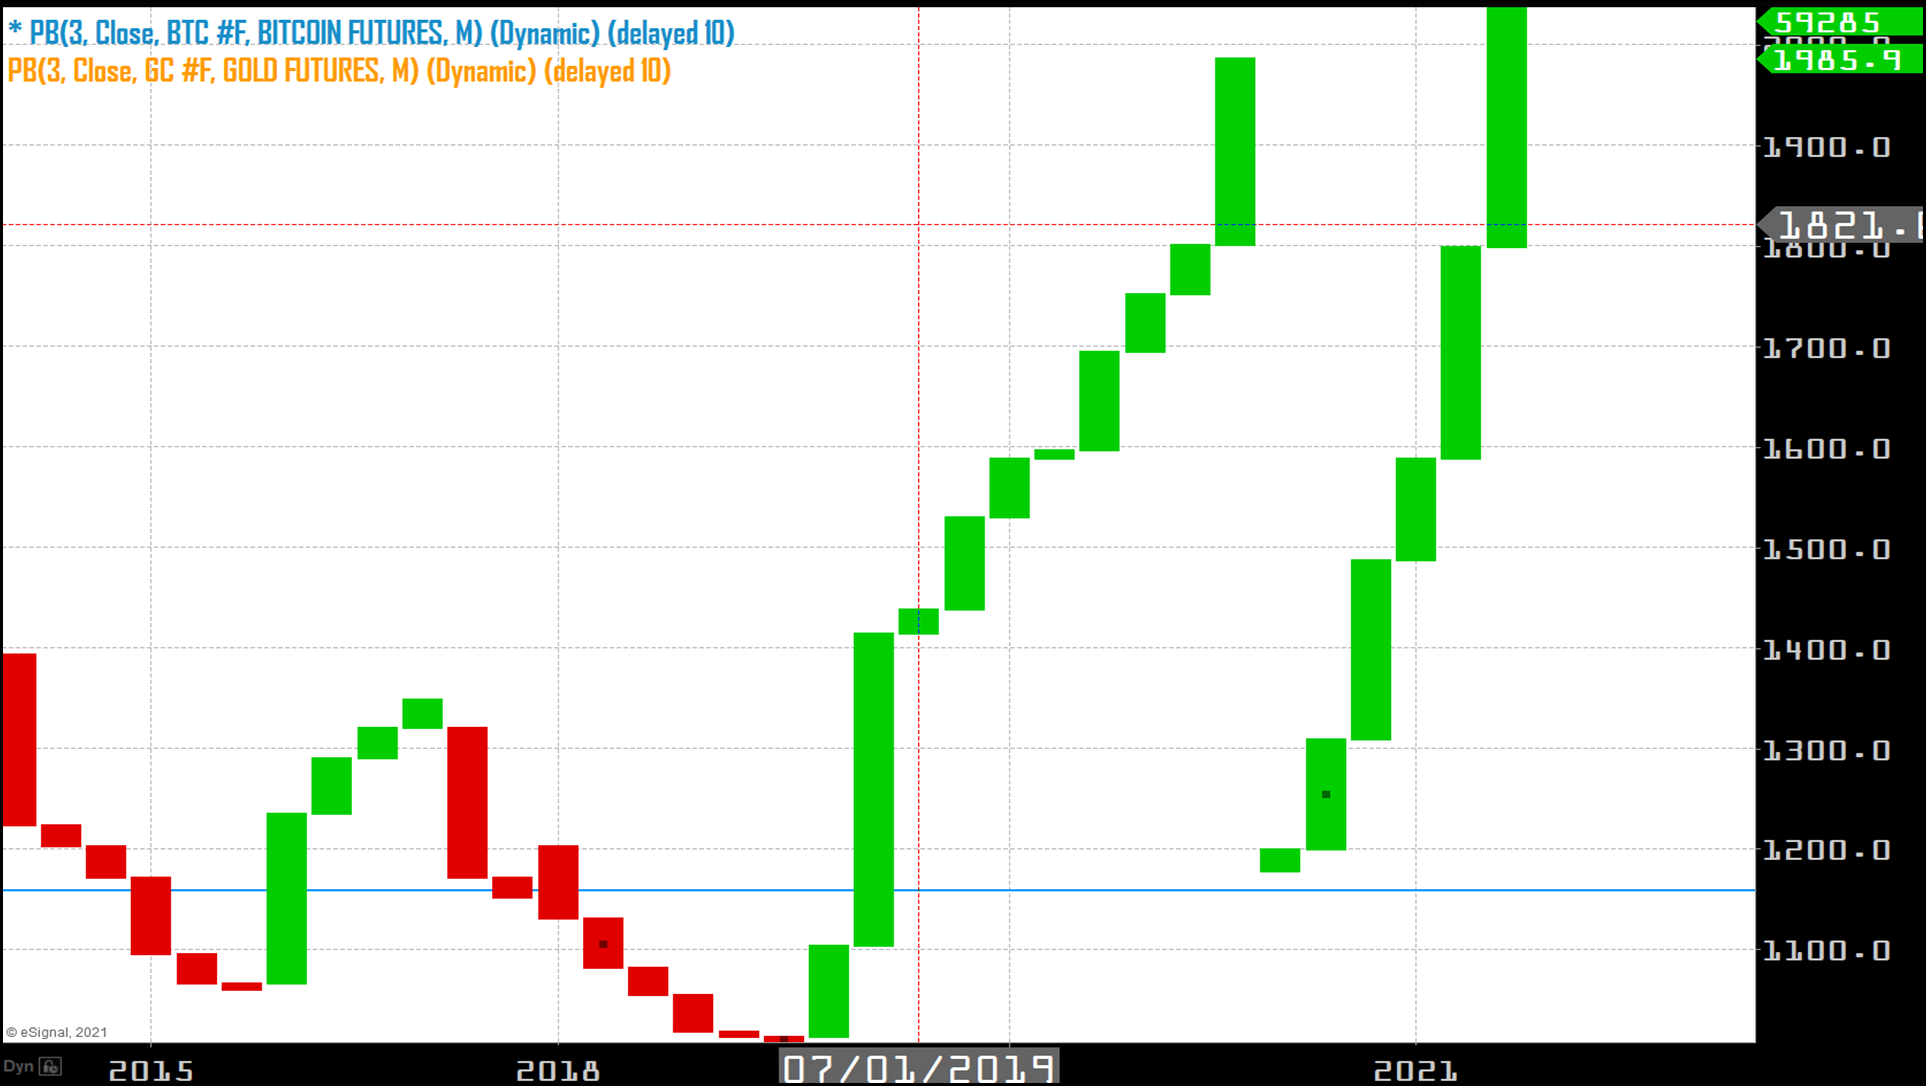
Monthly Price break chart of BTC and GLD.
This scenario in which gold action leads Bitcoin action by four months is quite interesting and can be viewed through the lows each achieved following their all-time highs. Once again, gold would find a bottom and trade sharply higher precisely four months before Bitcoin. I see this correlation as one that still exists. If so, it would suggest that Bitcoin is in the midst of a correction that could take it to below support at $44,000 down to the next level of support at $40,000 before a slight upside bounce followed by an even lower low (somewhere around $35k - $30k) before recovering back to where current pricing is now around $45,000.
If this correlation holds, all of this should occur within the next few months.