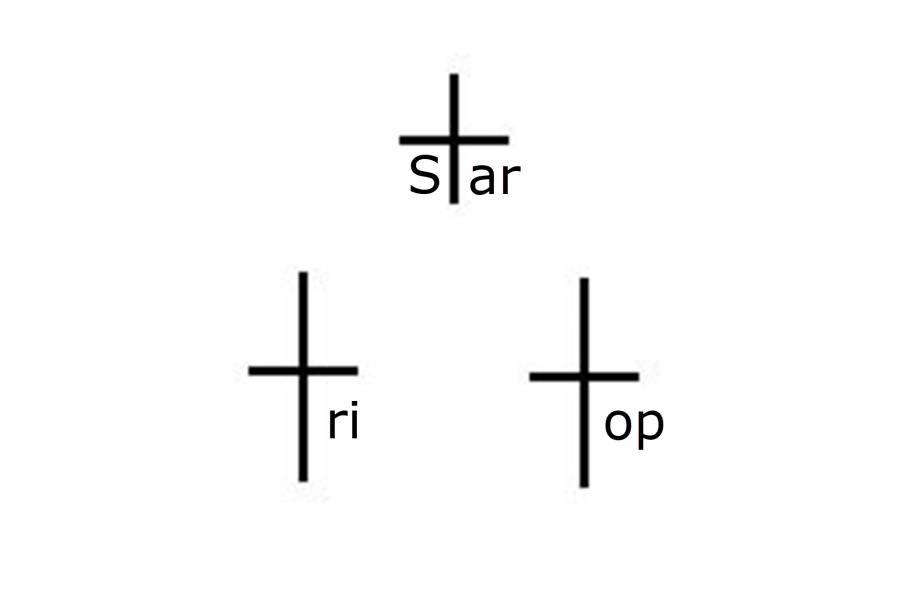
Tri star top in BTC?

With a higher number of the investment community eyeing Bitcoin through a bullish lens than ever before, do the technical back up their sentiment?
As for western technical indicators they are mostly bullish. You have all three major averages (50,100,200-day) in a bullish formation with the shorter-term averages above the longer ones. Prices are also well above these moving averages, with the current price of BTC futures basis the most active January contract fixed at $23,670. This puts the current fix in today’s shortened session a whopping $6,530 above the 50-day moving average and $12,290 above the 200-day. These studies suggest that on a short- and long-term basis BTC is extremely bullish.
The relative strength index suggests that BTC is slightly overbought and is beginning a downward slope suggesting that a correction or period of consolidating is likely.
When we look for any significant candlestick patterns there are two different time frames in which the candles are setting up for bearish reversals at the start of next week. On a daily candlestick chart, you have a ‘Tri-Star Top’ that formed over the last three daily sessions.
A ‘Tri-Star’ pattern is created when you get three consecutive Doji candles with gaps between all and the first gap is in the opposite direction of the second gap. For the bearish version of this pattern to hold any weight, it must come after a defined uptrend, with the first gap between the first and second Doji candles being a positive one and the second gap between the second and third candles being a negative one meaning a gap to the downside. We have met these criteria and a drop in prices next week would confirm this pattern. The overbought RSI gives the somewhat low accuracy reversal pattern more credence.
On a weekly candlestick chart, we have formed the first two candles of a ‘Three River Evening Star’. Similar in many ways to the ‘Tri-Star Top’ it predicts a reversal in a market and is somewhat more accurate. This pattern is also weighted heavier in probability when you have a confluence of indicators like we have with the RSI being over 70 currently at 77.95.
The fact that we have two bearish reversal patterns appearing on different time scales gives the probability of a reversal more probable. If we get a red candle on Monday then we could see a re-test of the $19,500 support area. This will all depend on Monday’s candlestick, which is largely going to be determined this weekend in the spot markets. Traders still long that aren’t hodlers (long-term holders) should take note and consider pulling profits or at least raise stops to $22,900, the area we recommended last night.