Wave hello to your new ATH in Bitcoin

The first SEC approved Bitcoin ETF debuted yesterday and October 19th will go down in the history books as a landmark date, just as May 19th will be recalled as a day of despair. Pro Shares Bitcoin Strategy ETF trades under the ticker symbol BITO and tracks the price of Bitcoin futures (BTC). BITO started its first trading session at $40.88 per share and closed almost $2 higher at $41.94, equating to a 4.85% increase on the day matching the gains seen in Bitcoin.
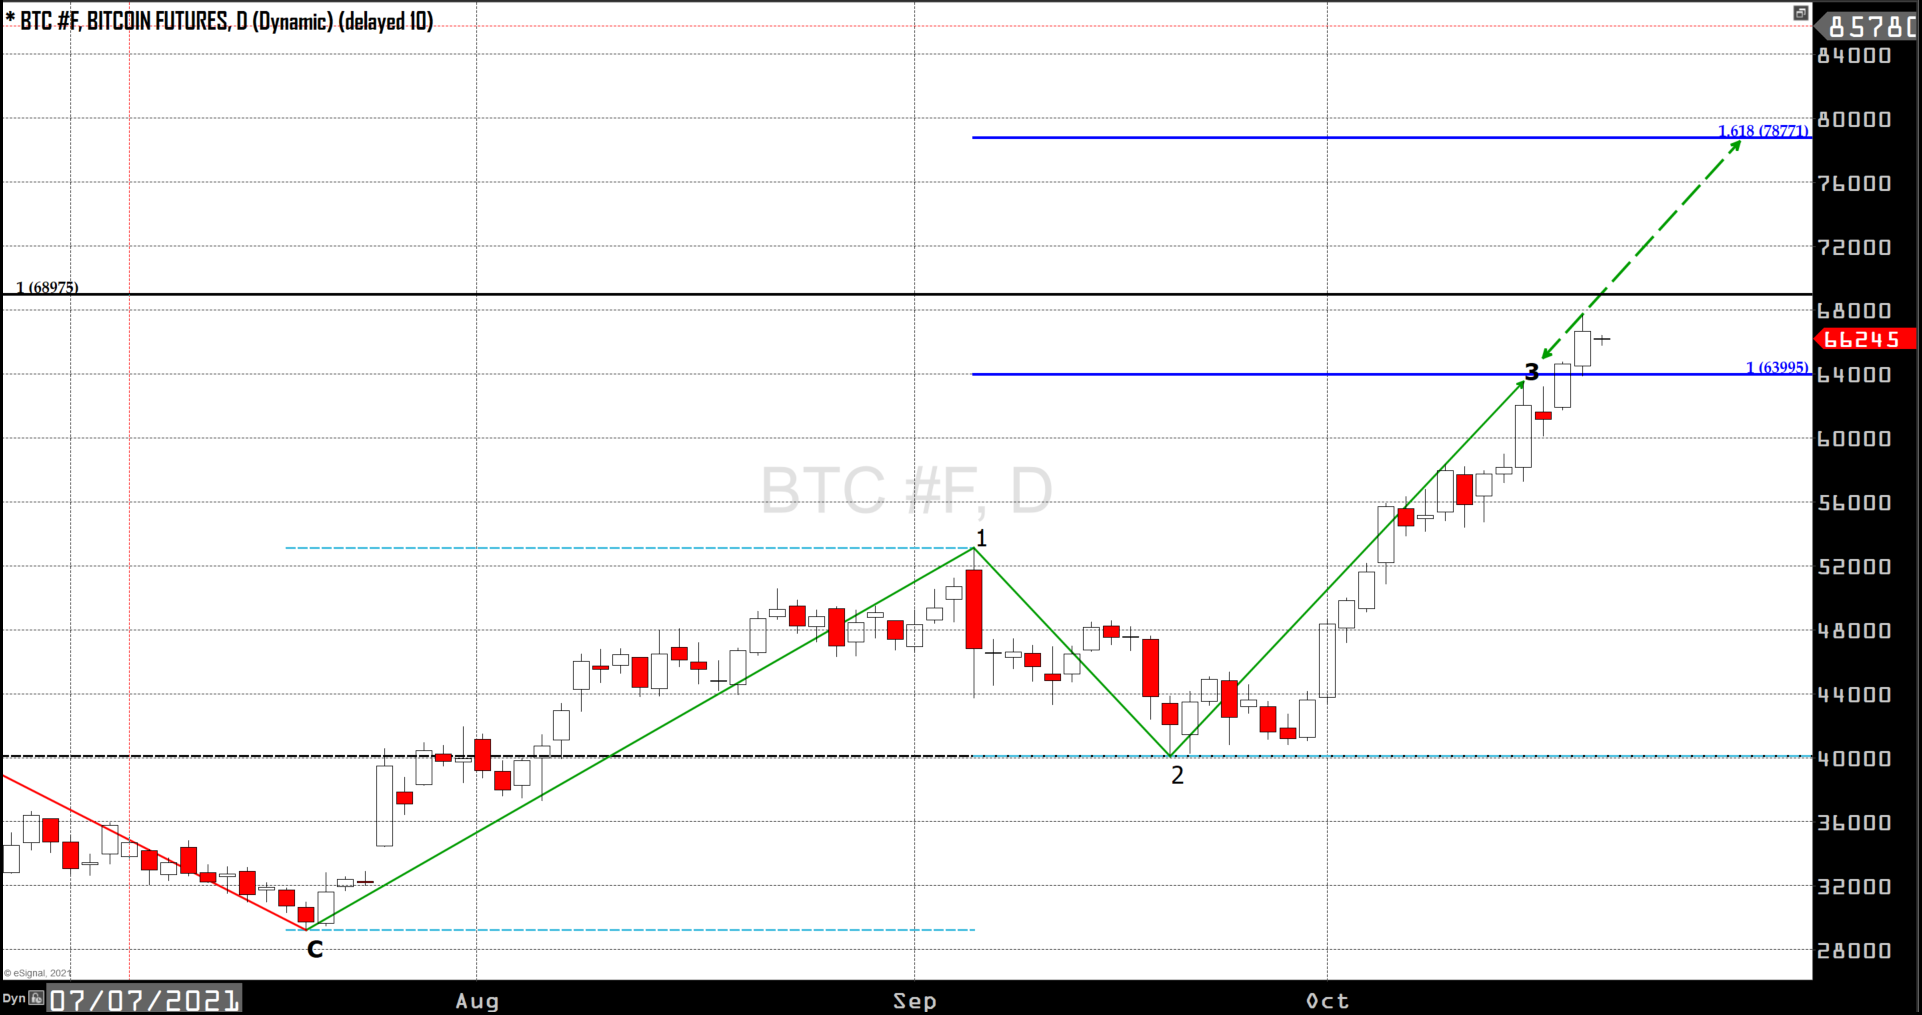
Yesterday we saw the highest close on record for BTC at $64,500 breaking above resistance that resided at $62,000, and today we officially made a new all-time high. As of 4:20 PM EDT, BTC futures are trading up almost 3% or $1,800 at $66,540. Ethereum also played catch up today currently up 7% back above $4,000 for the second time. At $4,080 ETH is still 6% below its own all-time high but has matched Bitcoins weekly gain with both seeing a 15% rise week over week. With Bitcoin now in price discovery mode, where can we expect to see this rally conclude?
The best way to forecast a market in new territory is with Elliot wave principle and its use of Fibonacci extensions.
In the weekly candlestick chart of BTC shown below I have drawn in the cycle that first took us above $60k that began at the end of 2020, the A, B, C correction that followed from mid-March to mid-July, and the current bull count we are presently in. I have added to Fib. Extensions the first one in black is just a comparison of the third wave of the previous cycle to the current third wave we are currently in. the second extension in blue is relevant to wave theory. It is drawn to compare the recent third wave to the first wave of this cycle.
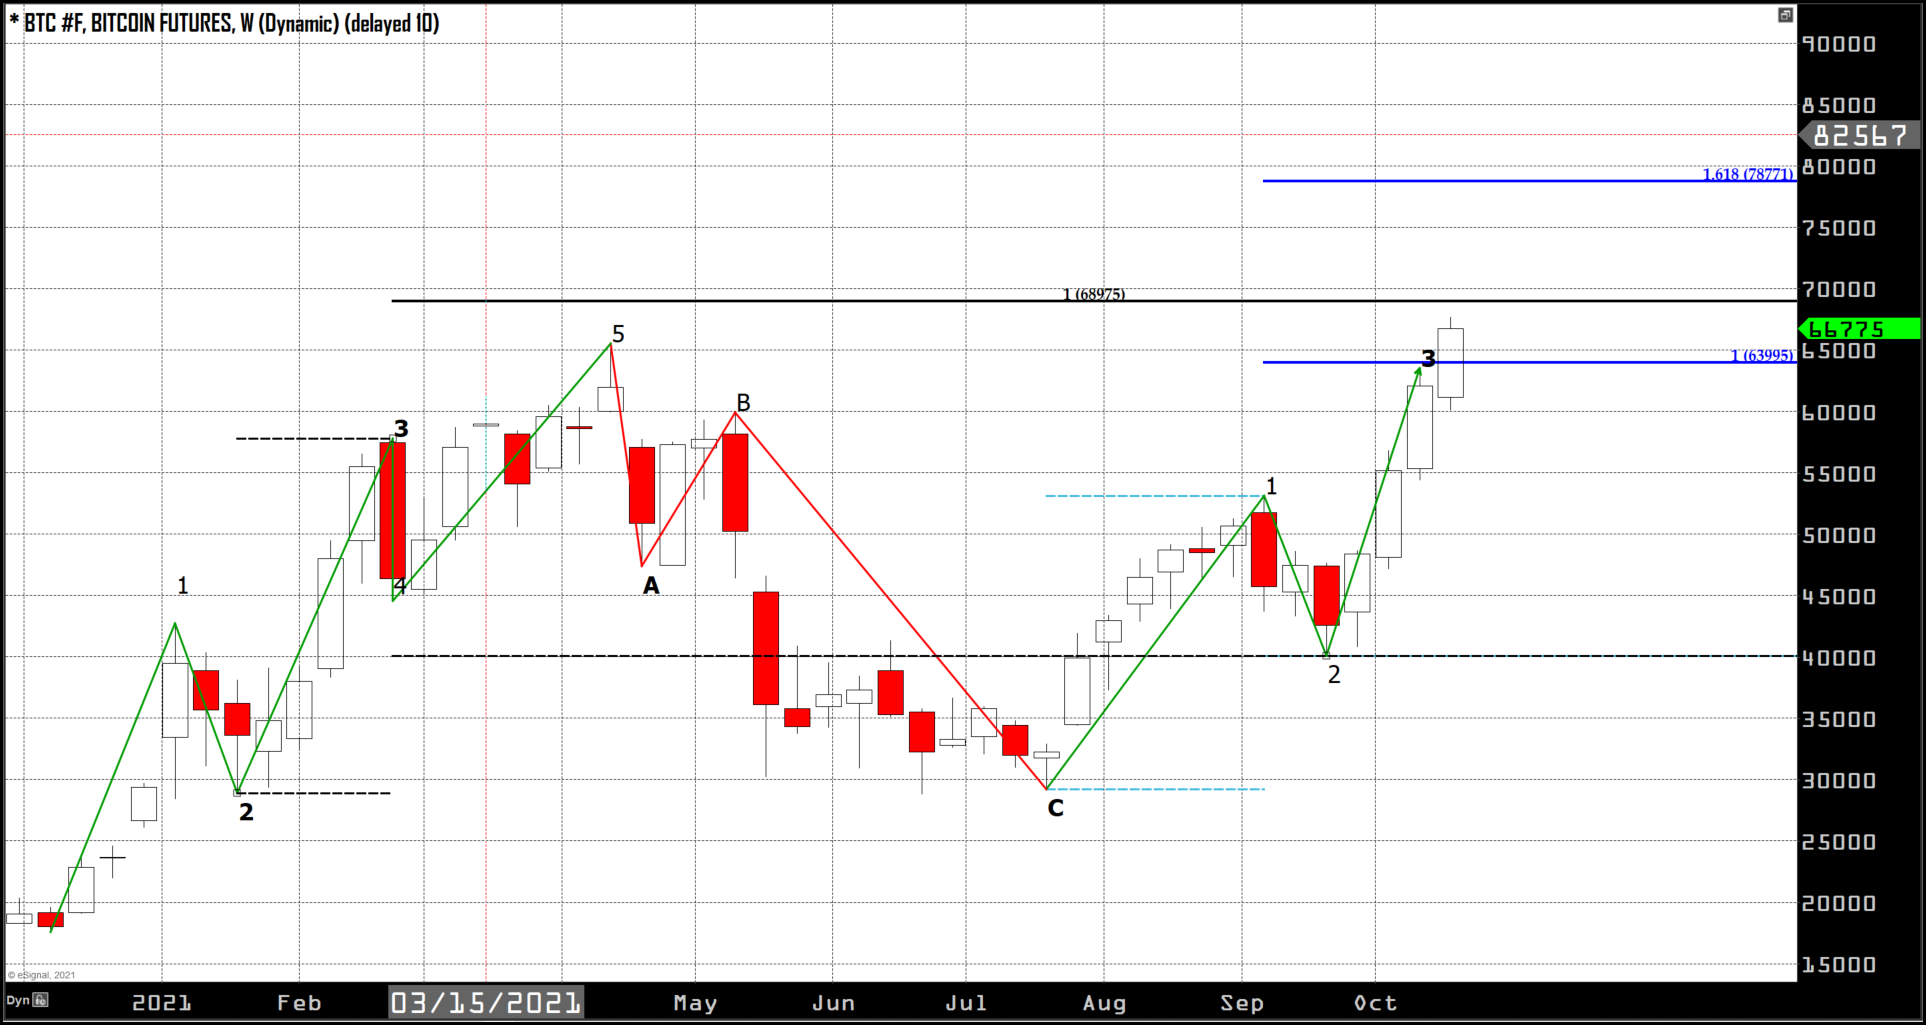
The first comparison tells us that if this third wave happens to be equal to the last cycles third wave or have a 1 to1 relationship, it would conclude at $68,975. Waves from one cycle do not tend to be relevant to the next cycle so this is more of a reference point than a target price point. The second extension in blue is relevant to the current forecast because when we compare wave 1 to wave three, there are rules and general guidelines we can use to forecast.
A rule that governs R.N. Elliot’s wave principle is that the third wave can never be the shortest of the three impulse waves (1, 3, 5). Typically, a third wave will have a length between equal length (1 to 1) and 1.618 that of wave 1. The rally that brought us to $65k in May (the first wave count on the chart) followed this guideline although it did not go much past a 1 to 1 relationship with wave 1. In our current cycle or wave count it surpassed the 1 to 1 ratio which equates to $63,995 in yesterday’s historic price action and the low of today matched up very closely to that number. Wave principle predicts that a likely conclusion point for this wave three rally would be at $78,770, a 1.618 relationship to wave 1. However, this is not a rule and third waves can go to up to 2.618 even 4.618 the length of wave 1, or conclude just at or above a 1 to 1 which would put us in our corrective wave 4. Regardless of whether it is wave 3 or wave 5 that gets us there, this rally will likely conclude somewhere in the area between $75,000 and $85,000.