Bitcoin break out or break down?

In our last article, we discussed the flat bottom descending top in BTC, which defined resistance since the beginning of June. We noted that this upper resistance line was tested five times giving us an indication that this resistance has tracked the highs over the last five months. Today we have yet to witness BTC break out of this wedge pattern as we get closer to the ever-narrowing apex.
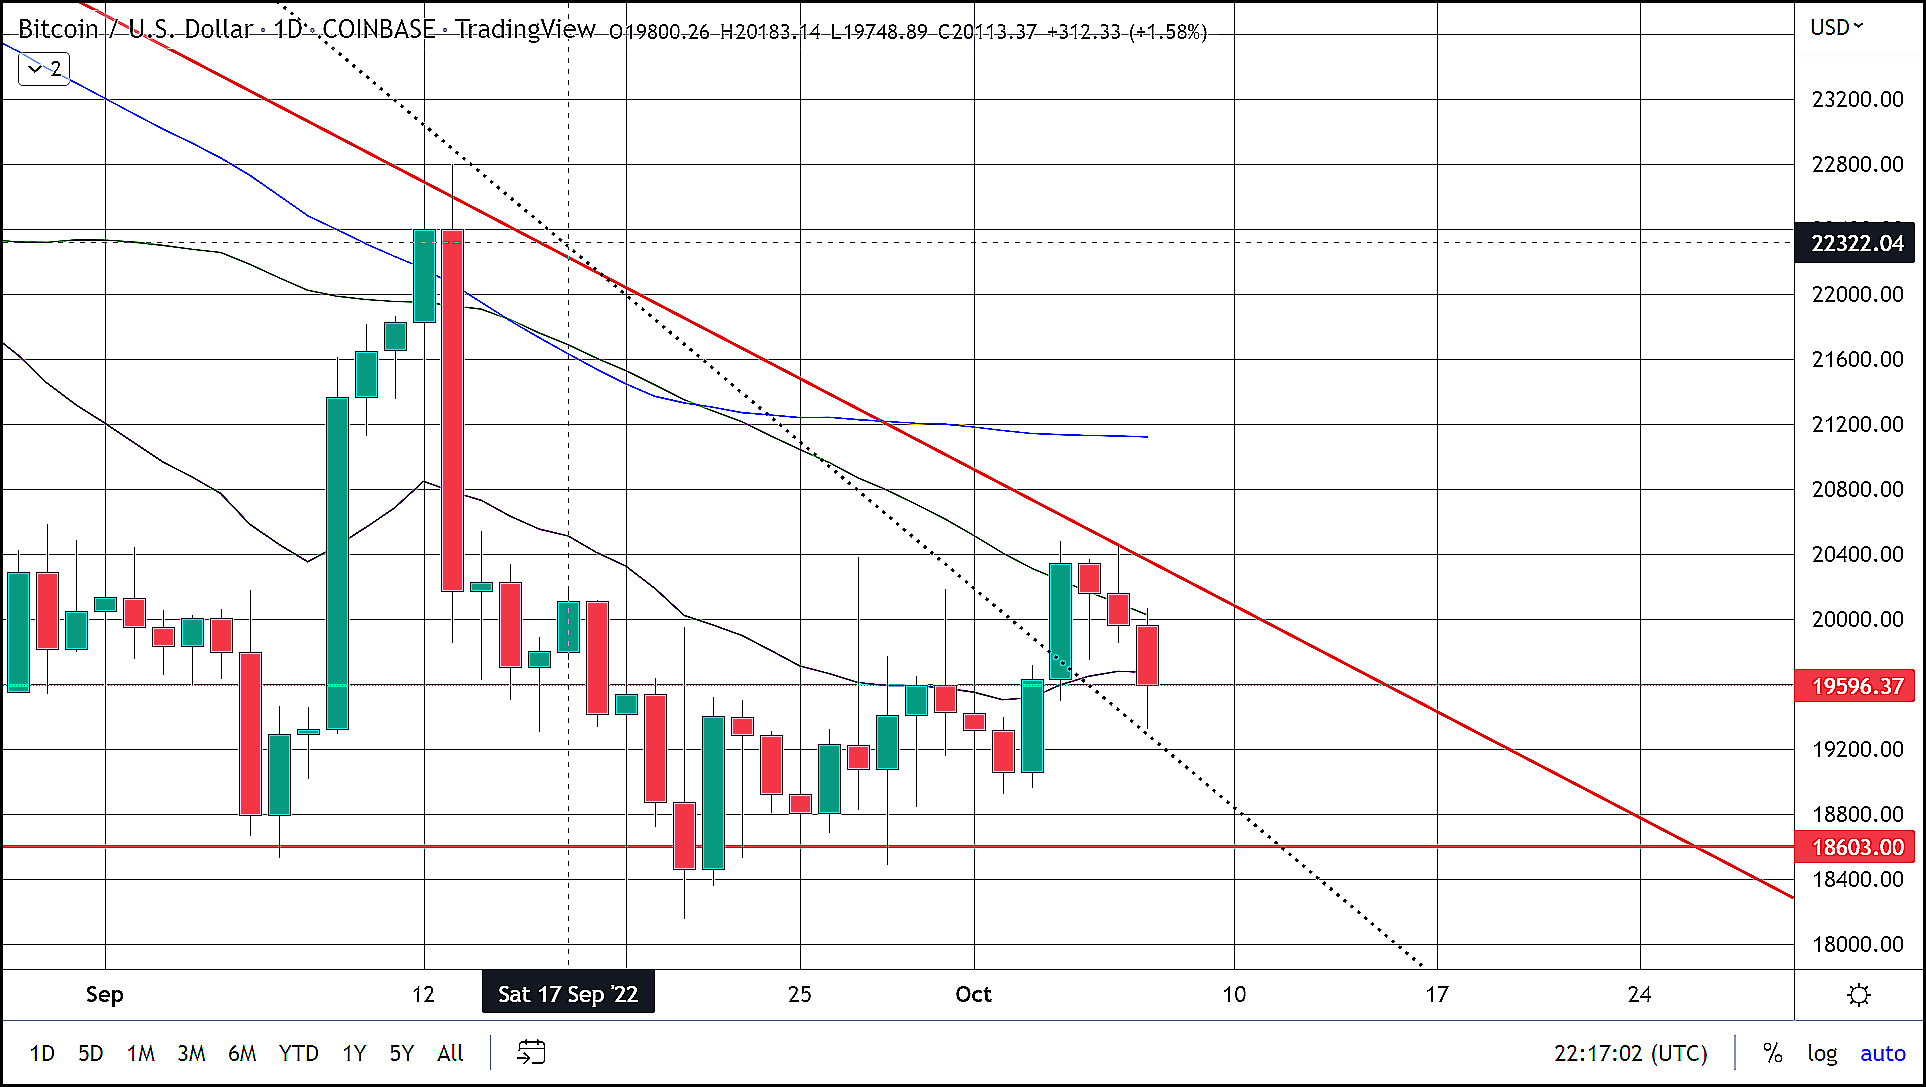
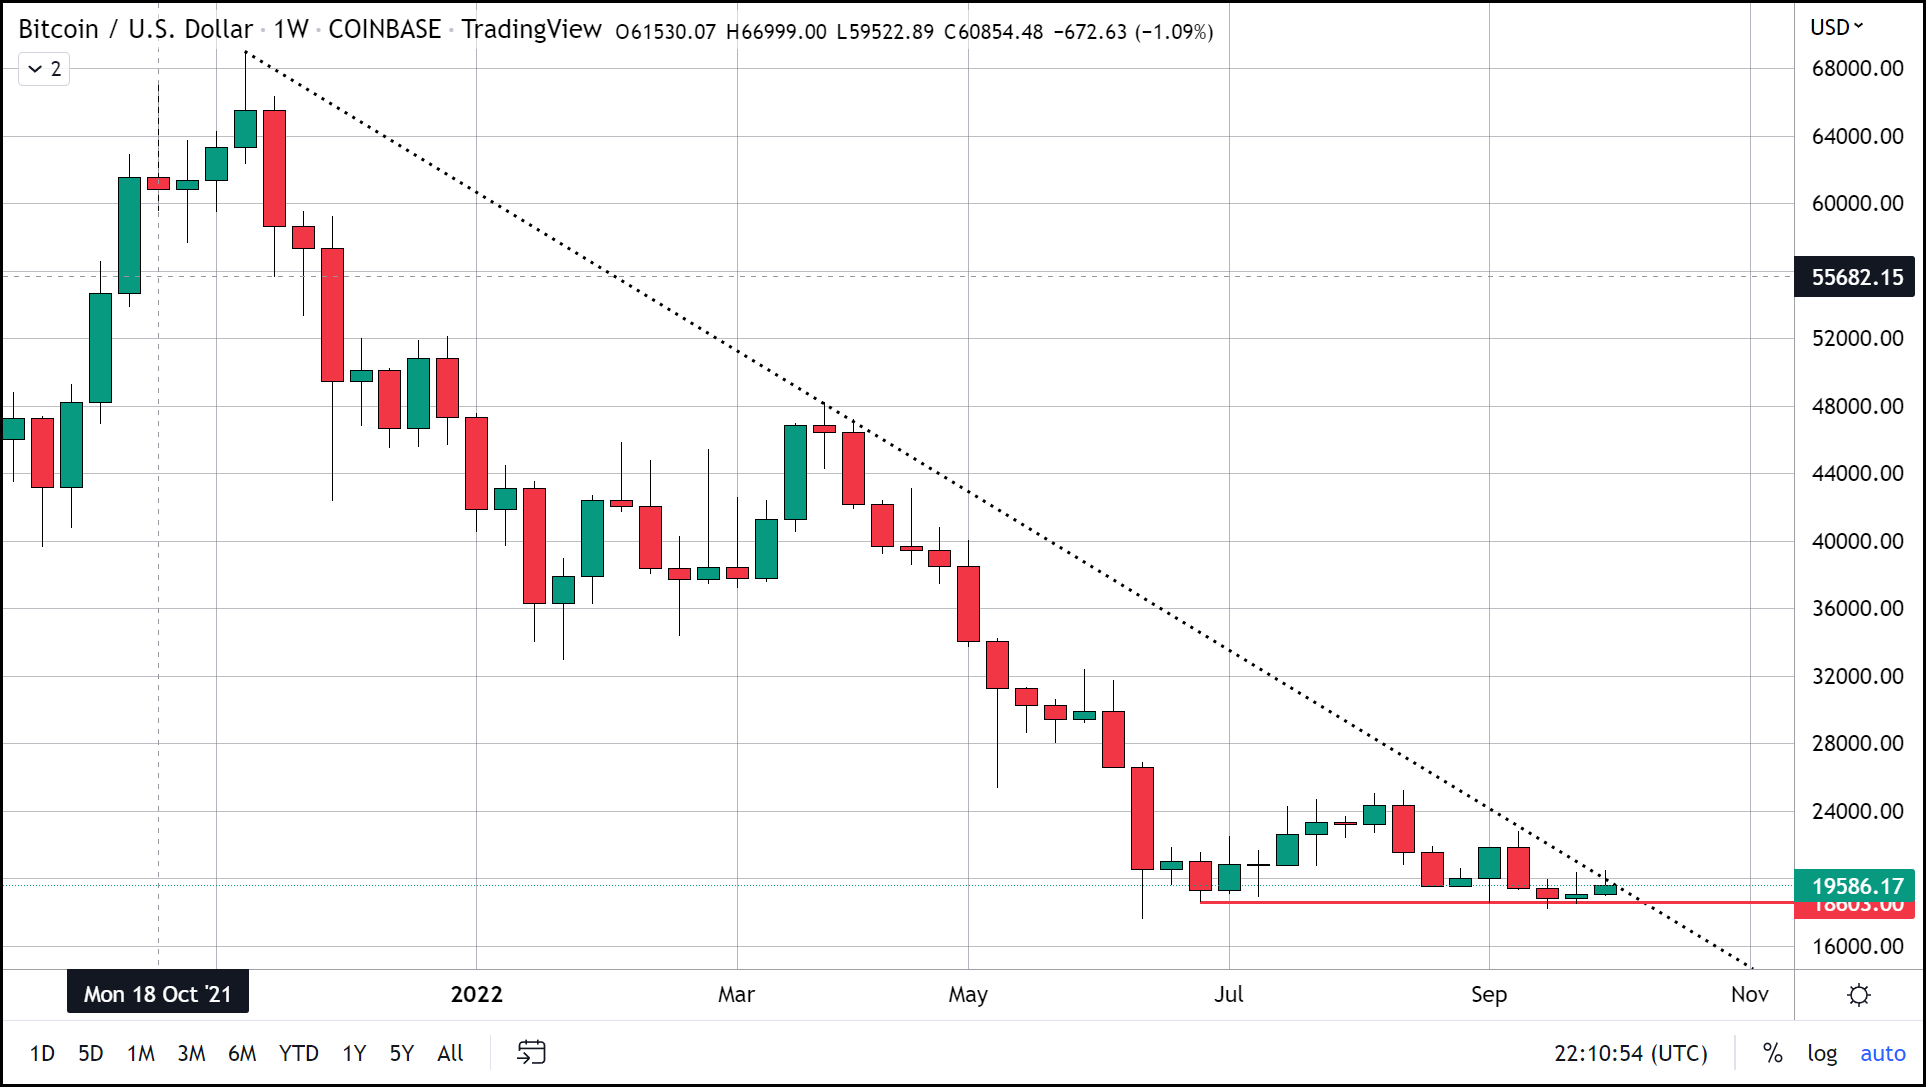
Today we are going look at an even longer spanning resistance trendline stretching back to the all-time high on November 21, 2021. Even though this trendline was only tested on two occasions over its 11-month span the fact that it tracks starting at our all-time high and was effectively unbroken for such a long time gives us a hint that this may be an even more important resistance line. Interestingly enough this upper trendline was broken above on October 4 and has subsequently a support area for today’s trading. That there may be support now at this descending trendline the fact of the matter is it is still angled downward and set to hit support at around $18,500.
More technical supporting bitcoin’s bear market continuation is that BTC failed to hold above its 50-day moving average and as of roughly 1:00 PM in Honolulu BTC (CoinBase) is currently trading around roughly $19,500 after having lost the $20,000 zone once more.
Happy “Hodleween”
October is generally seen as a very positive month for Bitcoin. Looking back at the previous five years shows us why this is widely believed. Out of the previous five Octobers from 2017 to 2021, we only have one October showing a decline or red candle and that candle is very small, more Doji candlestick. The other four Octobers in our study all had nice gains with two of them signaling the start of massive rallies such as in 2017 and 2020, while the last one exactly one year ago represents our largest monthly gain in the history of BTC.
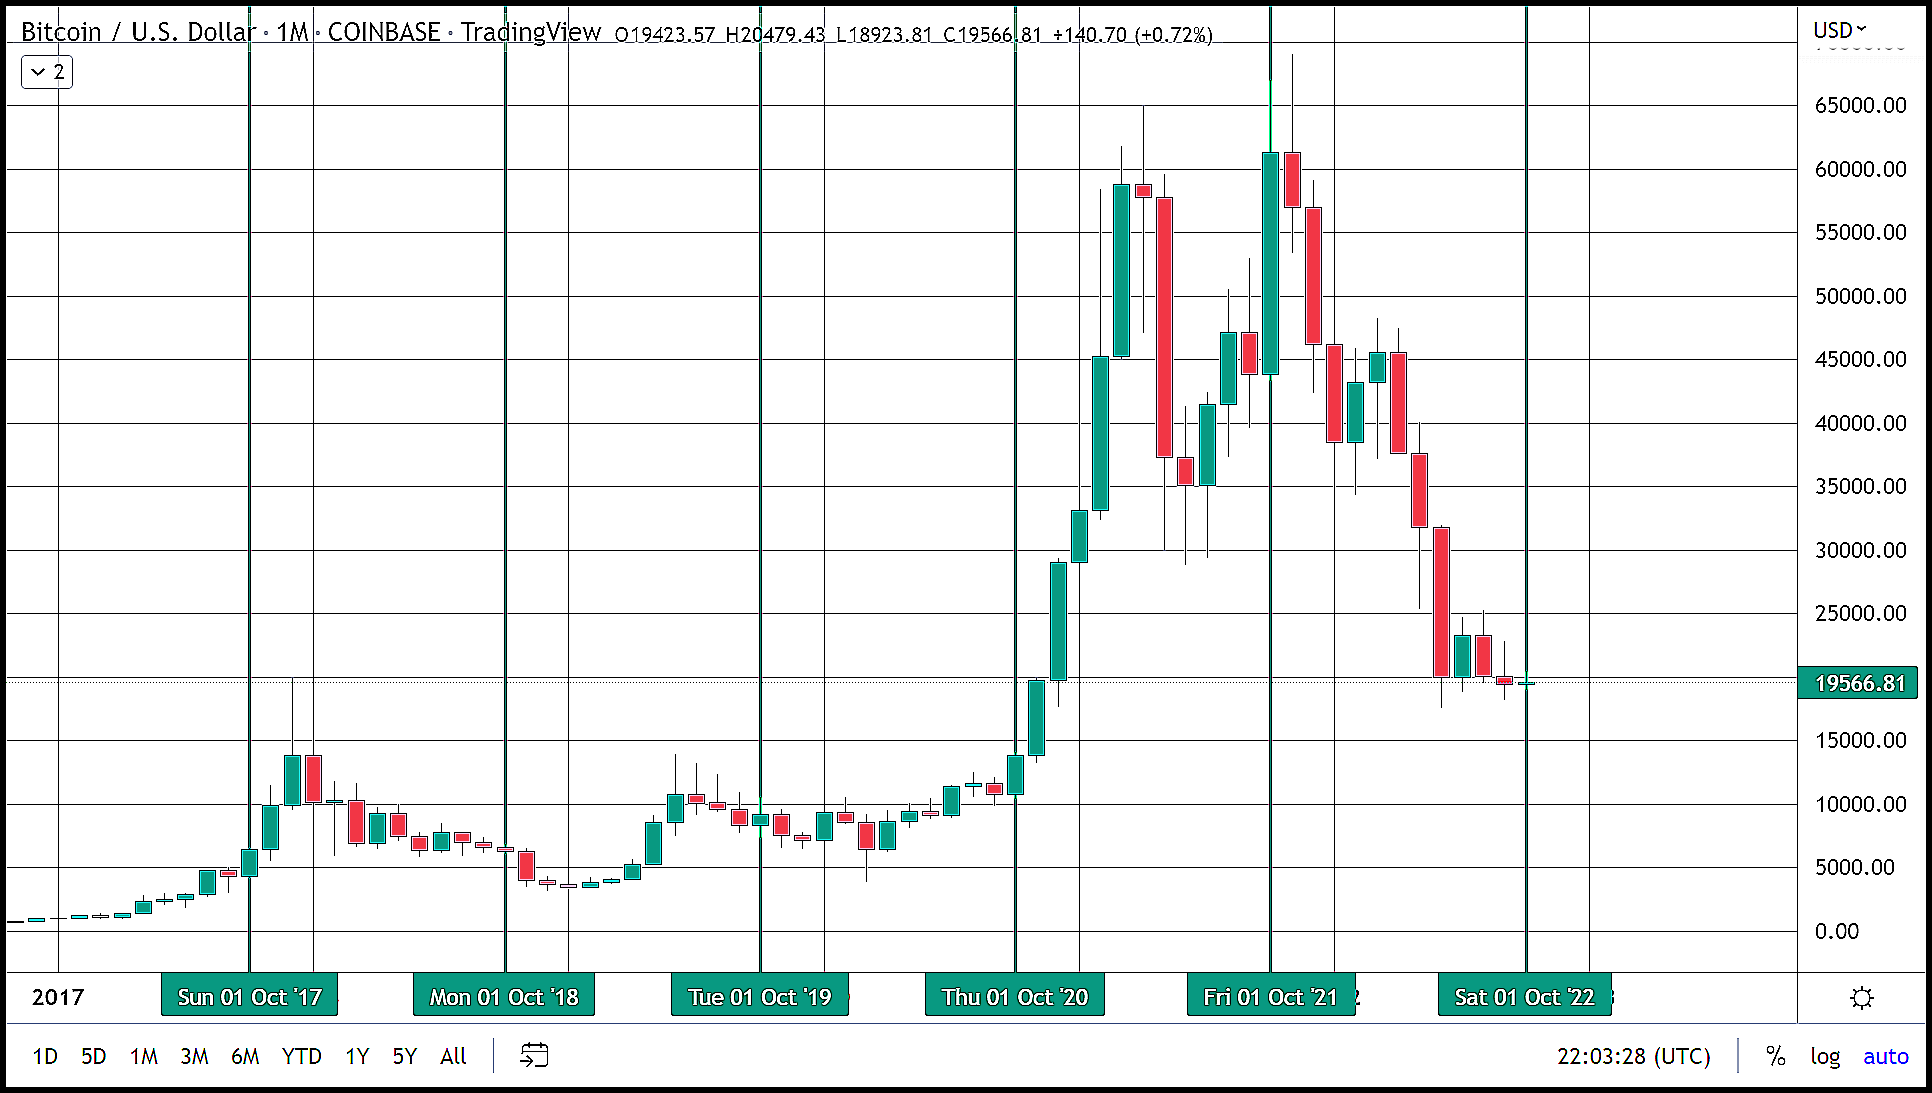
So, it does not come as a surprise that BTC bulls are looking closely at this month for any sign of a pivot back to a bullish mode. Although not yet complete and very small, are current monthly candle is still technically green and if this October proves to be anything like most Octobers for BTC then we would expect a breakout from the wedge pattern towards the upside which could be very strong due to the significance of the resistance that would have been taken out. If this scenario were to play out, we would likely see BTC back above the 200-week moving average which currently sits at approximately $23,500. This would be taken as a sign that the bottom was hit and a rally is likely to follow. If this perfect scenario plays out expect to see tested at the 61.8% retracement from the pandemic lows to the all-time highs at $28,742.
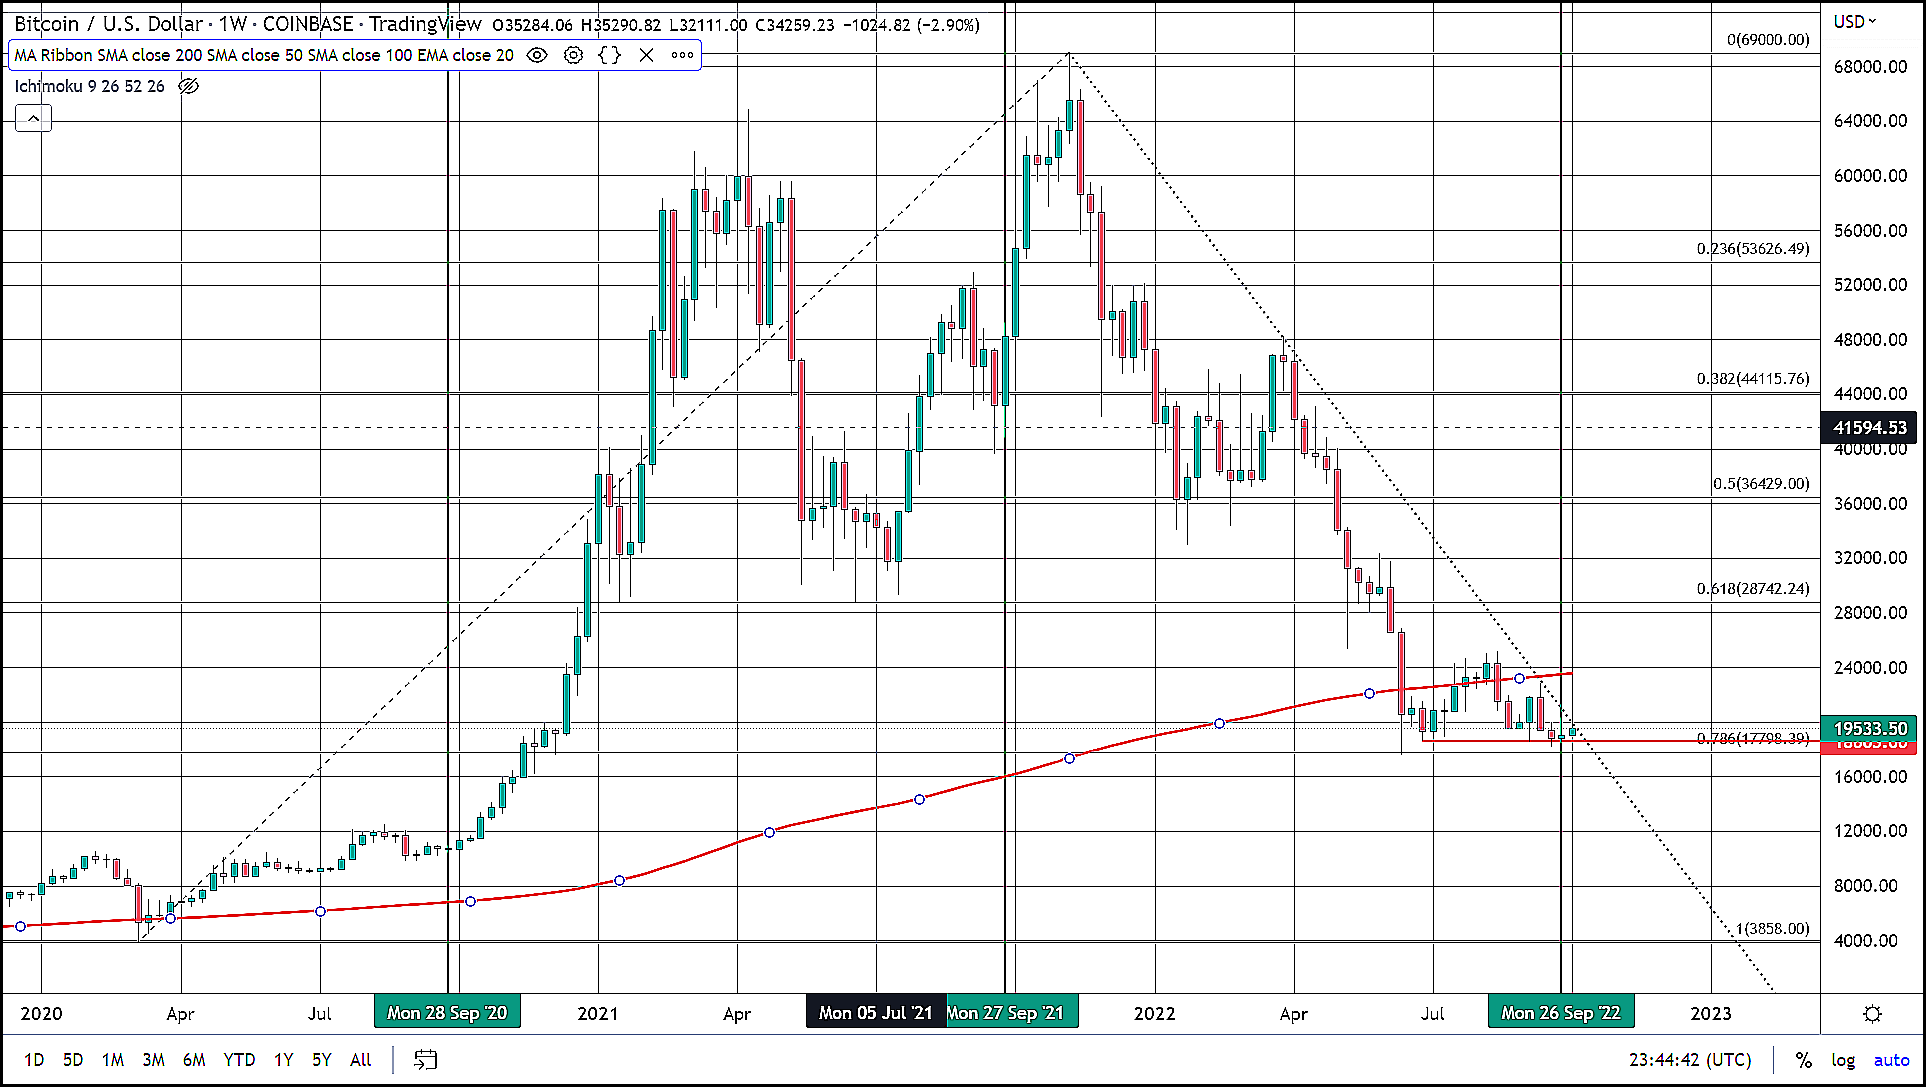
However, if BTC does not manage to break out and instead breaks down losing approximately $18,500 we would see an equal amount of built-up energy released in the other direction. Should this happen our lower-end target is one we have been calling for as a possible bottom for quite some time between the prices of $14,000 and $12,500.