Bitcoin fails third attempt to close above short term 61.8% short term retracement

Over the last four days, Bitcoin has had consecutive higher highs but is lacking any signs of a bullish reversal.
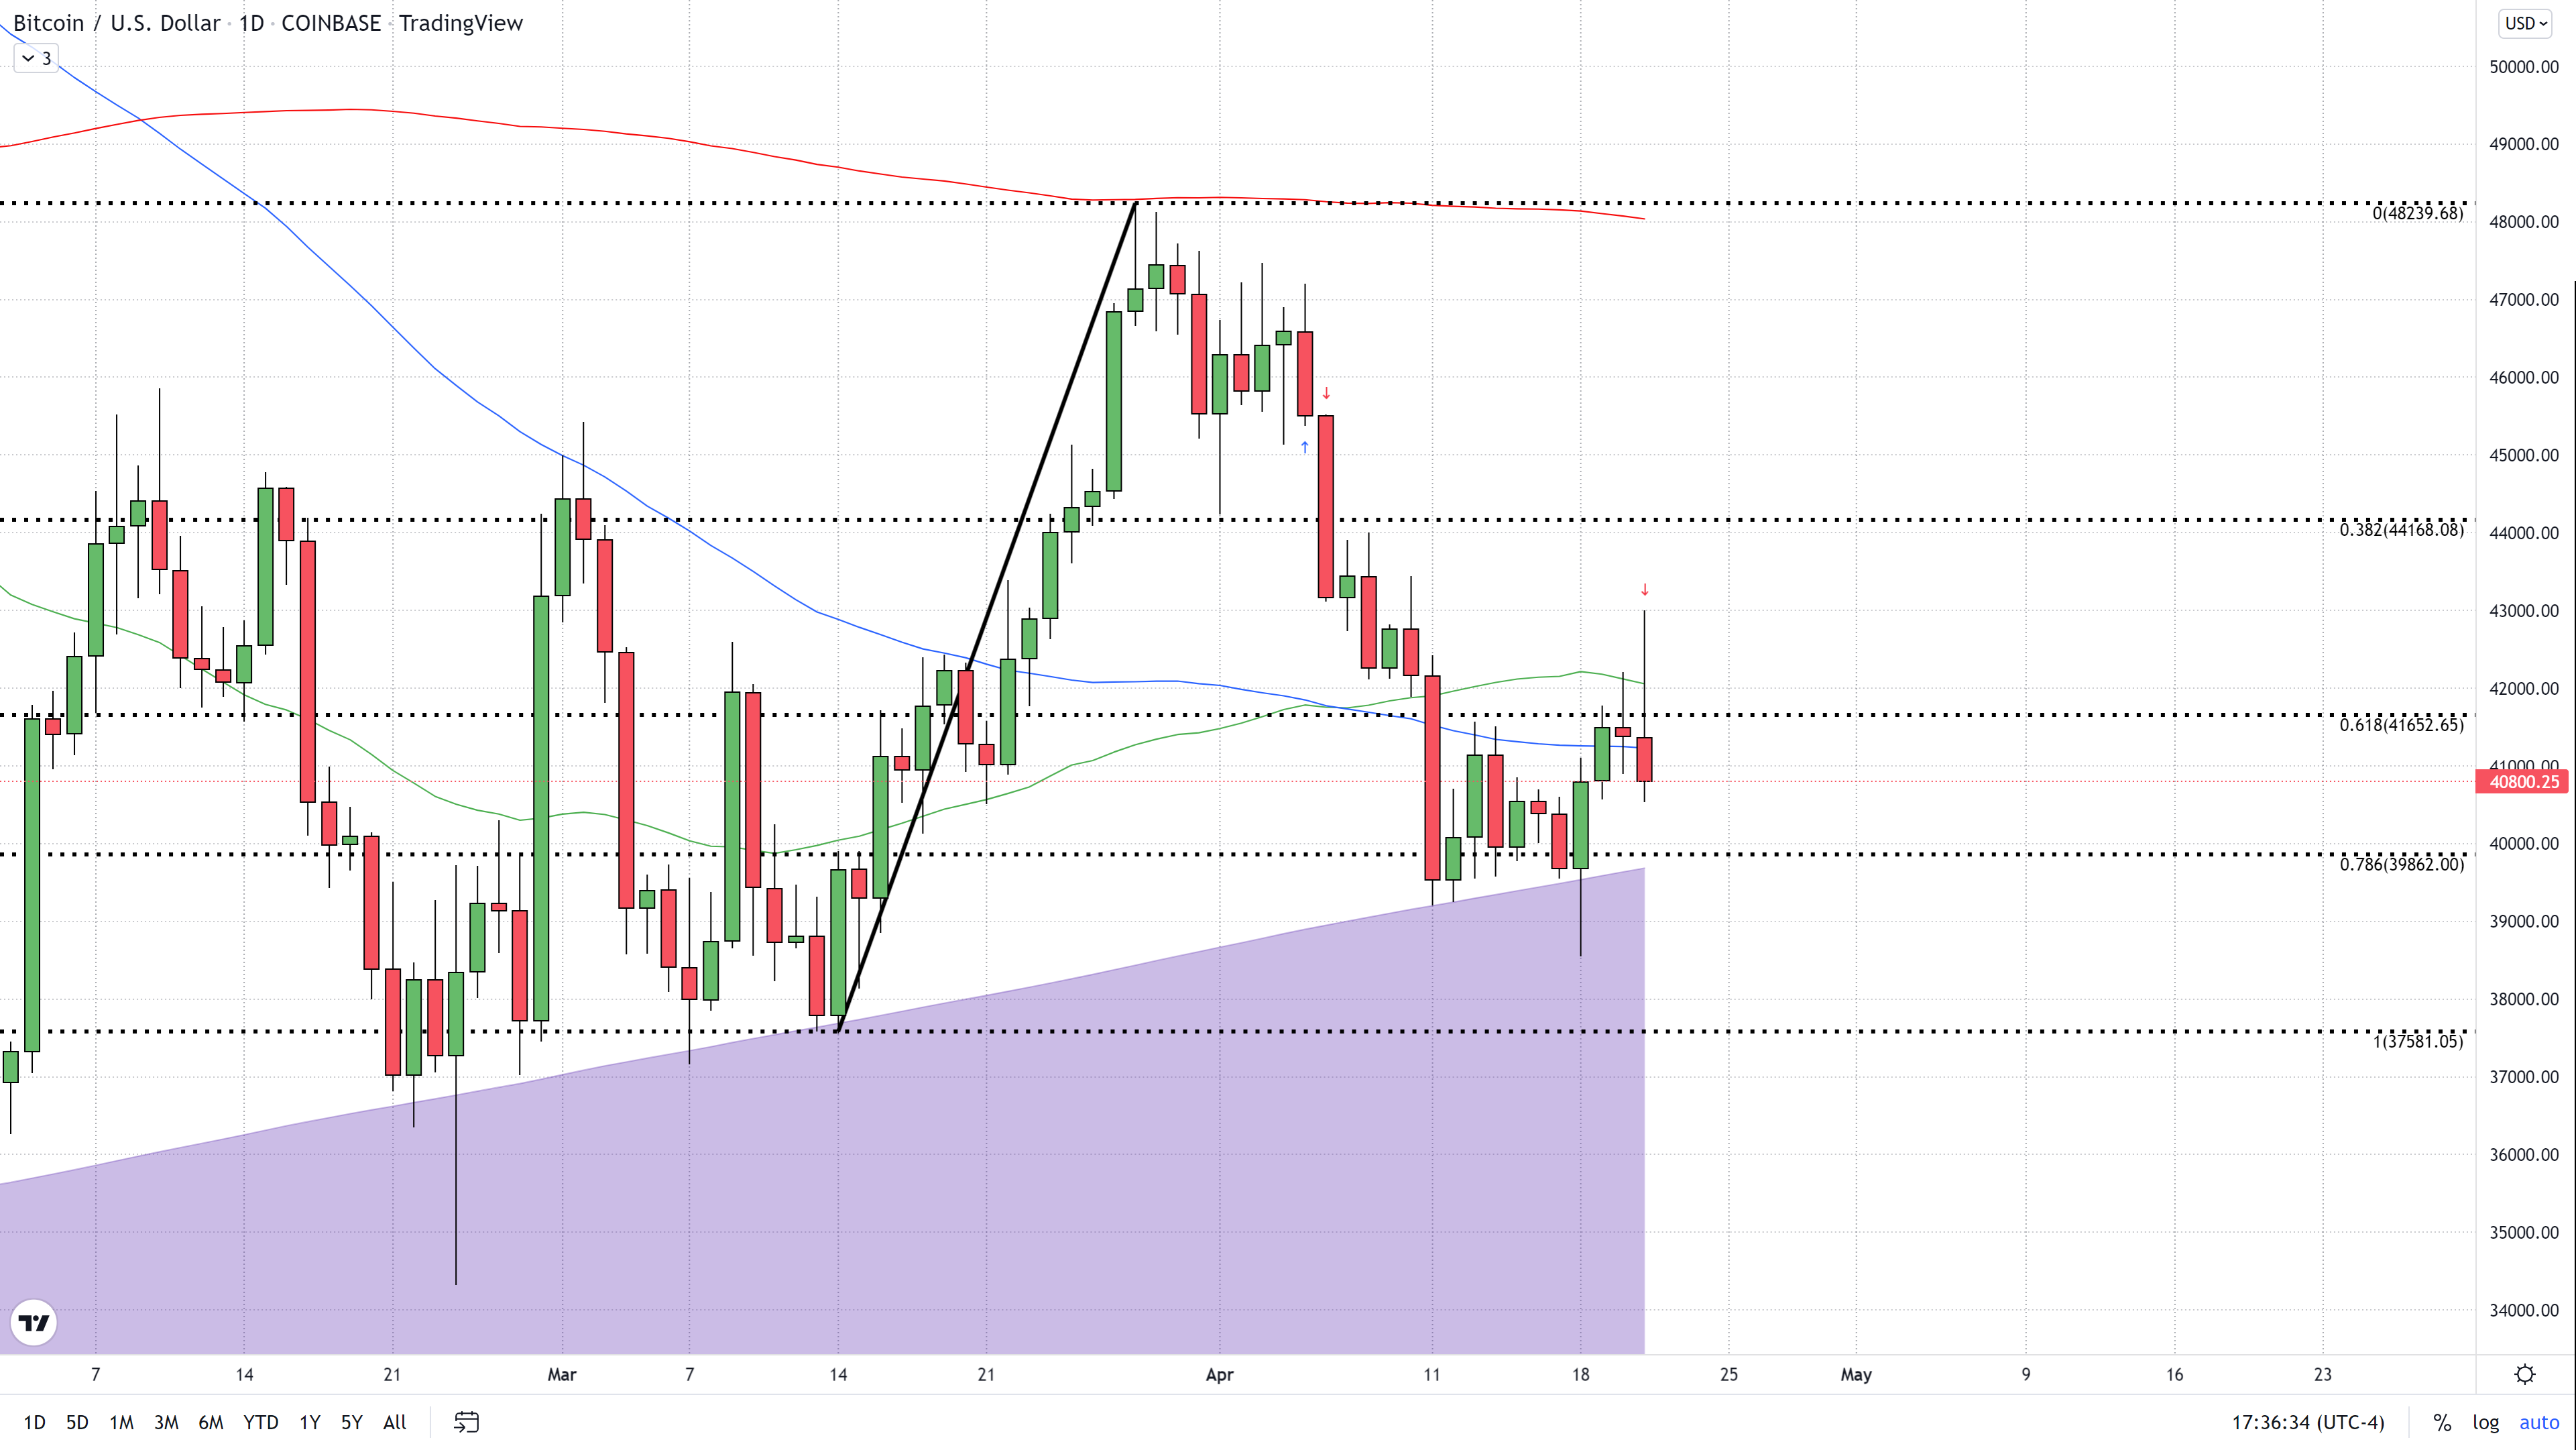
On Monday, Bitcoin closed significantly higher after recovering from an extended low that reached $38,500, the lowest trading point seen in over a month. Today Bitcoin had the opposite action with an extended high and long upper wick, and as of 4:50 PM, ET has a large red body reflecting lower pricing since the open and is trading hands at about $40,700 (Coinbase). Today’s trading has erased the gains made on Tuesday and looks poised to head lower.
The main technical reasoning behind a bearish outlook is the failure to move past the 61.8% Fibonacci retracement level of a short-term data set. The data set spans from the lows of March 14th at $37,500 up to the highs achieved on March 28th at $48,200. The last three days, while having made higher intra-day prices, have failed to close above this key level which sits at $41,650 (61.8% retracement).
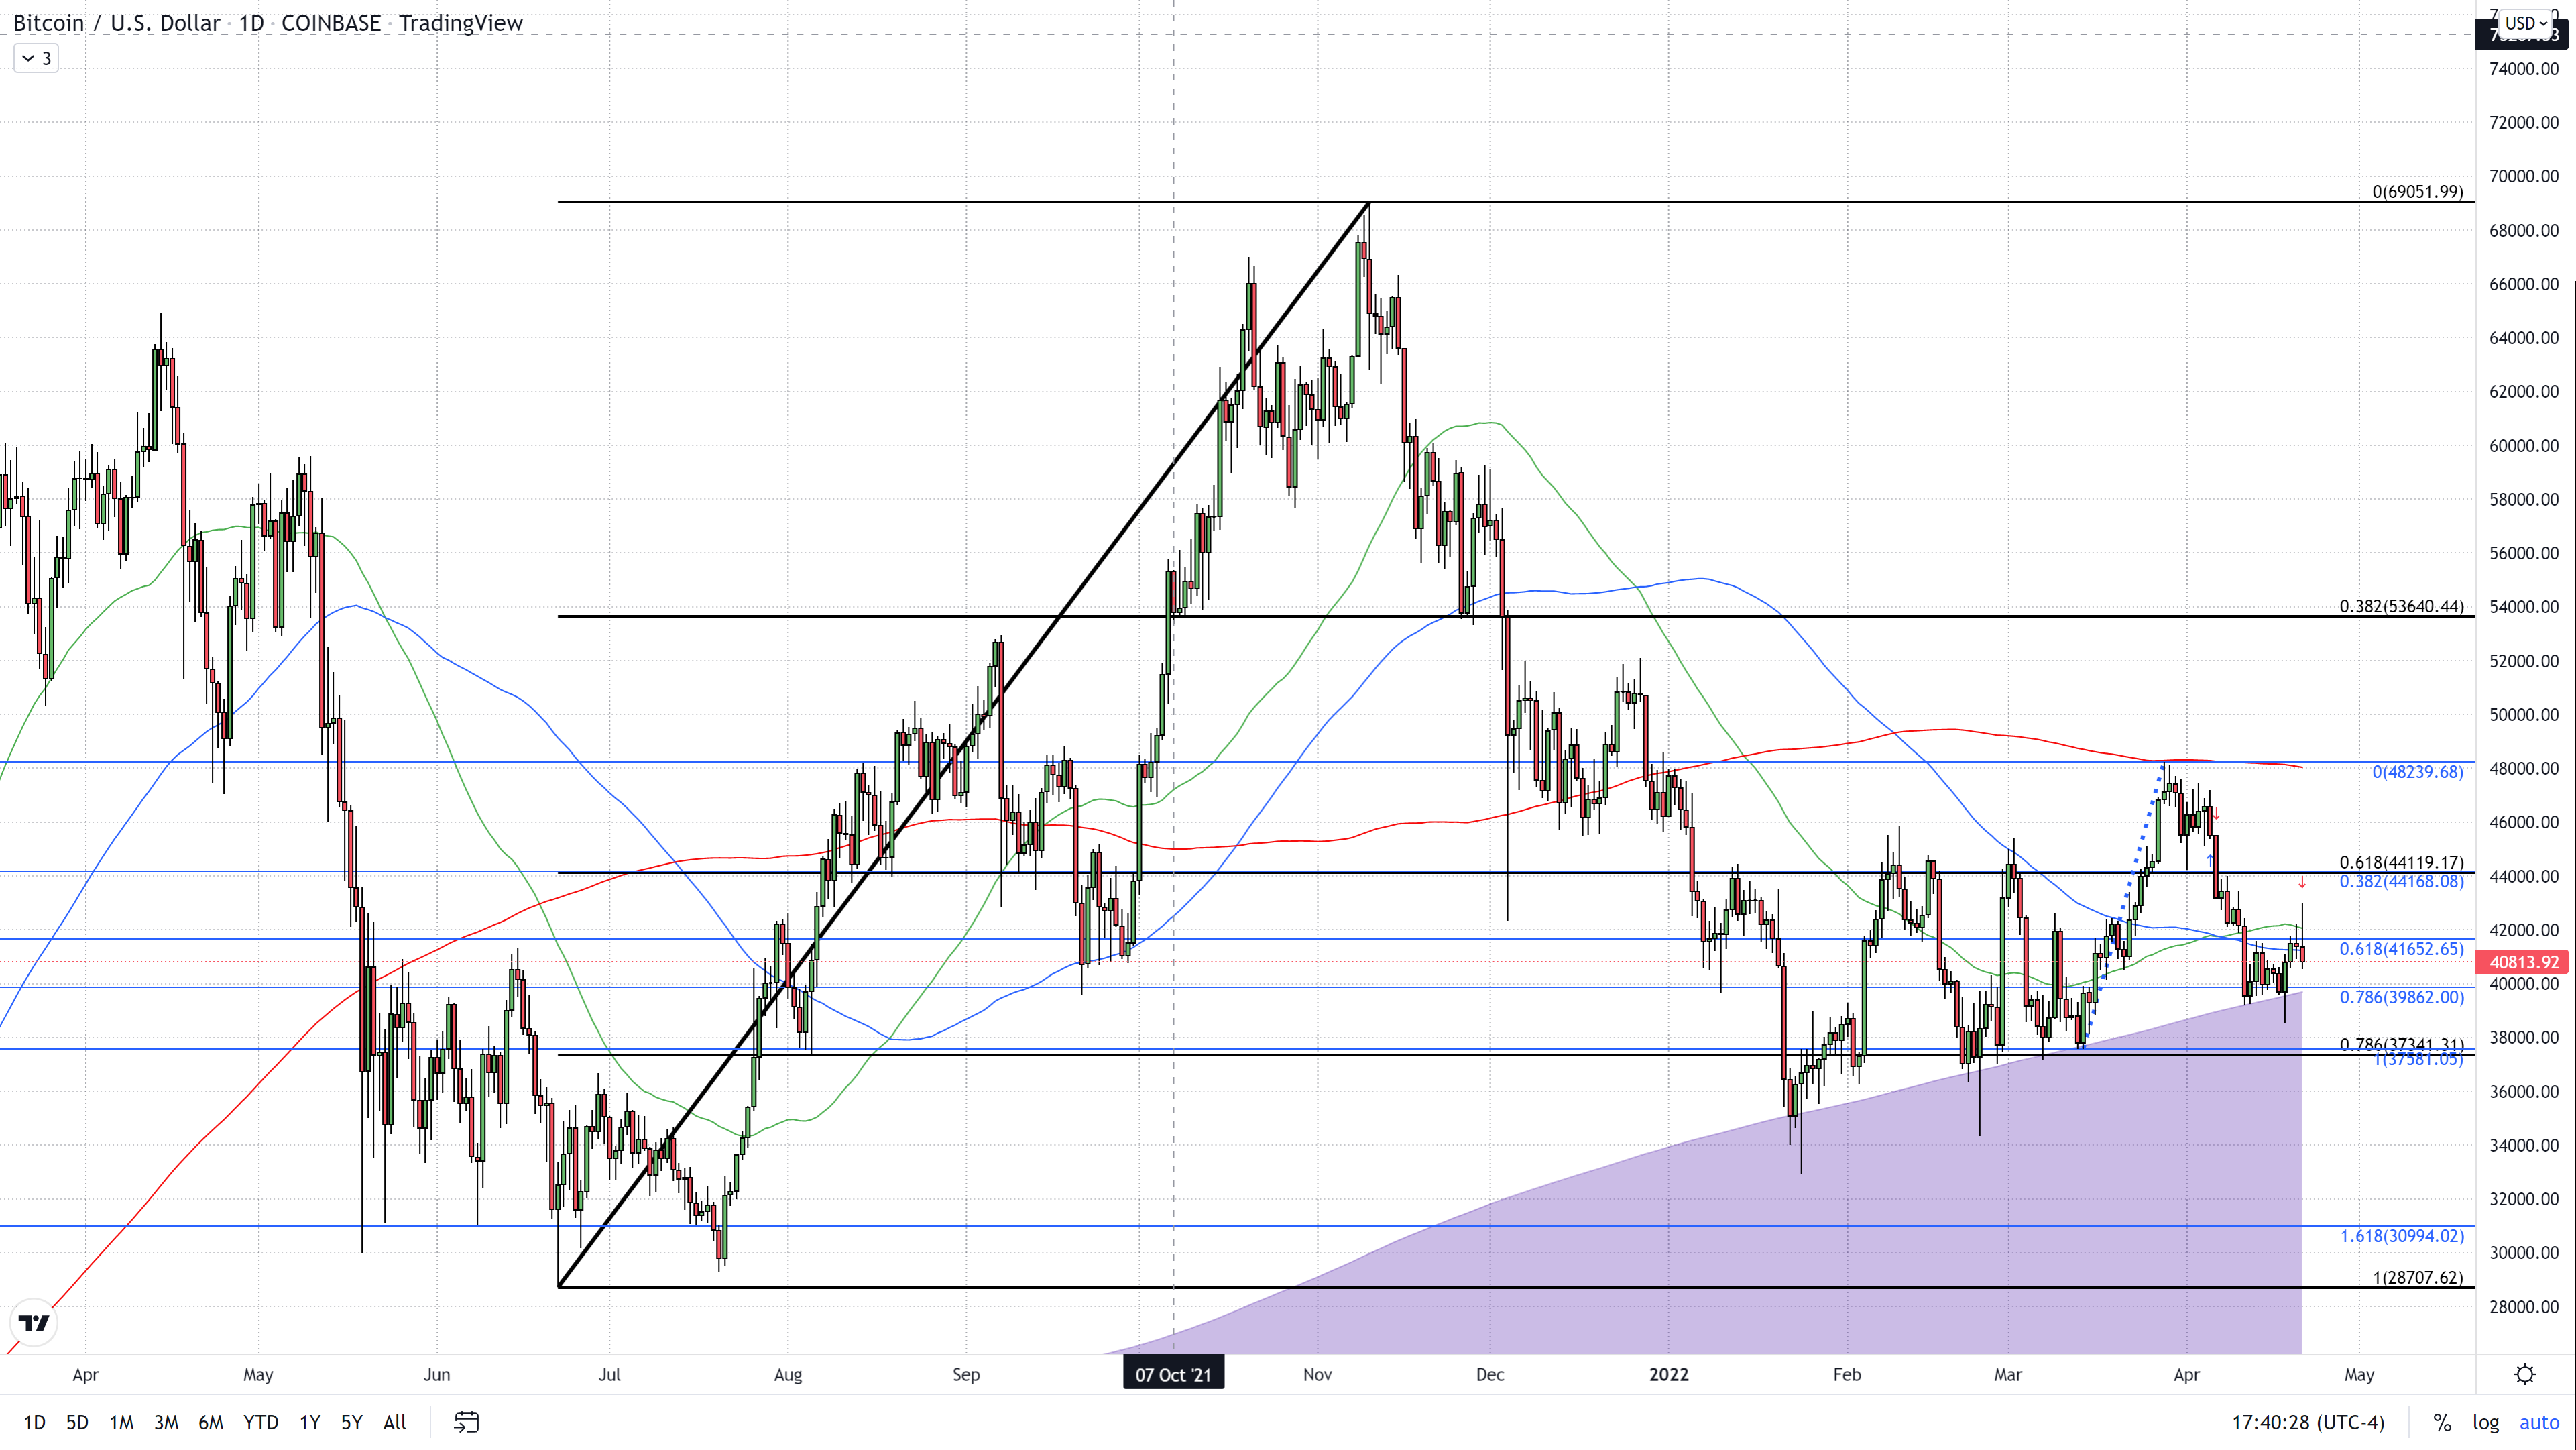
Our shorter-term data set also highlights a level that we have been watching as a Fibonacci harmonic. The level should come as no surprise to my readers or any trader who has been following Bitcoin and comes in at roughly $44,100. This level of true significant resistance resides at both the 61.8% retracement of our longer data set (in black) as well as the 38.2% retracement of our shorter data set.
The 50-day simple moving average that is currently pegged at $42,000 was the point that we had mentioned was necessary to overcome to make any sort of assumption that an actual rally was underway. This area also rejected BTC yesterday and today as we saw a move back below the 100-day SMA as well. Today’s action also made a variation of a three-river evening star appear made up of the last three trading days. For it to have been a true three river evening star, we would have had to have yesterday’s candle body appear above Tuesday’s and today’s. It is also worth mentioning that this candlestick pattern has to come after a defined uptrend. While we did move $1,000 higher on Monday, that one day move came after an actual downtrend. So, suppose we do get what would have been confirmation of this three-river evening star pattern tomorrow in the form of a red candle with both lower low and lower high, which is what I’m expecting. In that case, that signal could be traded the same way as if the traditional pattern met all of the criteria.
We can say with some certainty that our forecasting of a dead cat bounce on Tuesday the 19th seems to have been correct. It is for that reason that we issued a trade alert today to short the market. Our initial target is the 600-day SMA, currently pegged around $39,700. If we make it to that point, we can move our stops lower in order to lock in a no loss trade and see how it reacts this time at the 600-day because a break below this level would bring in the high likelihood of re-visiting $37,500, possibly much lower due to the significance that this support level holds.
So while this cannot be labeled as a three-river evening star, we are going to make up our own pattern, I will call this the three-river drowning cat.