Bitcoin at a historical breakout zone

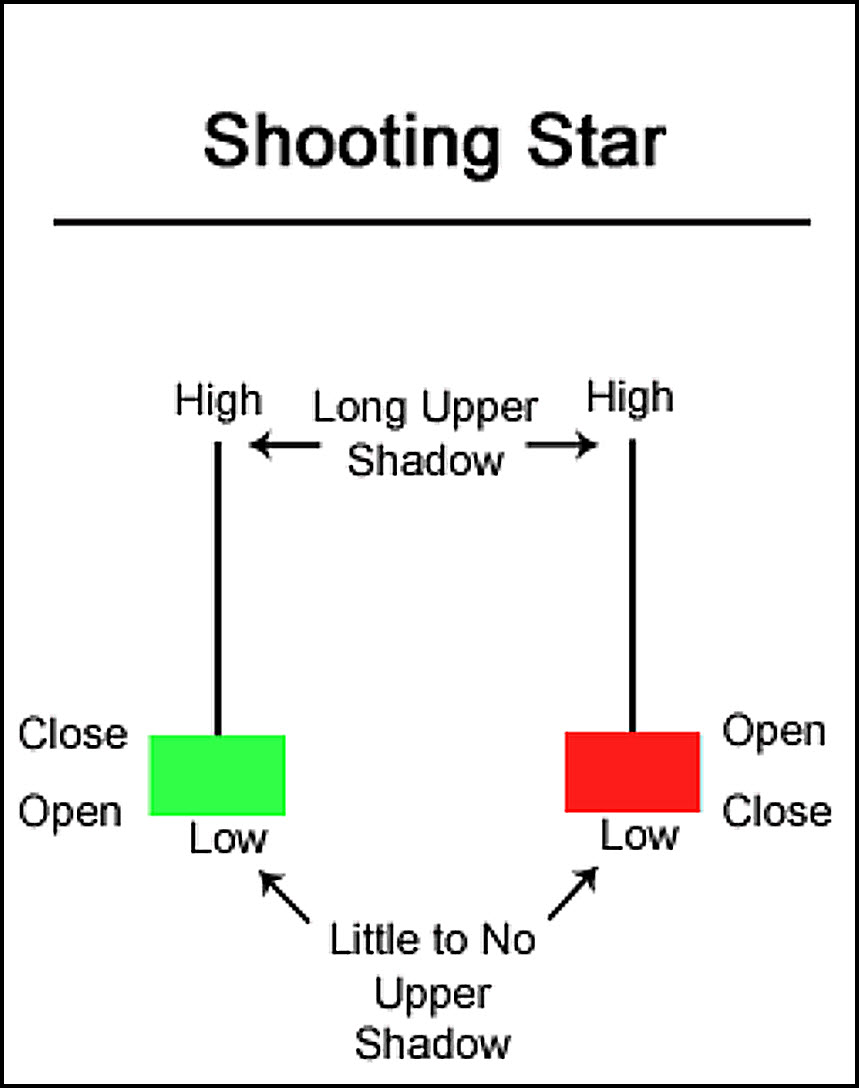
Bitcoin has had three consecutive lower lows with Saturday’s action resulting in a Doji followed by yesterday’s candle as well as today’s (and Saturdays) can be loosely labeled as shooting stars, which are candles that form at the top of a rally with a small body and a long upper wick. These candles consist of a small body (either green or red) and must have a wick at least 2 – 3 times the length of the body. These Umbrella line candles can only be taken seriously when they form at the bottom or top of a price move, if at the bottom they would be labeled an inverted hammer and forecast exactly the opposite of one another.
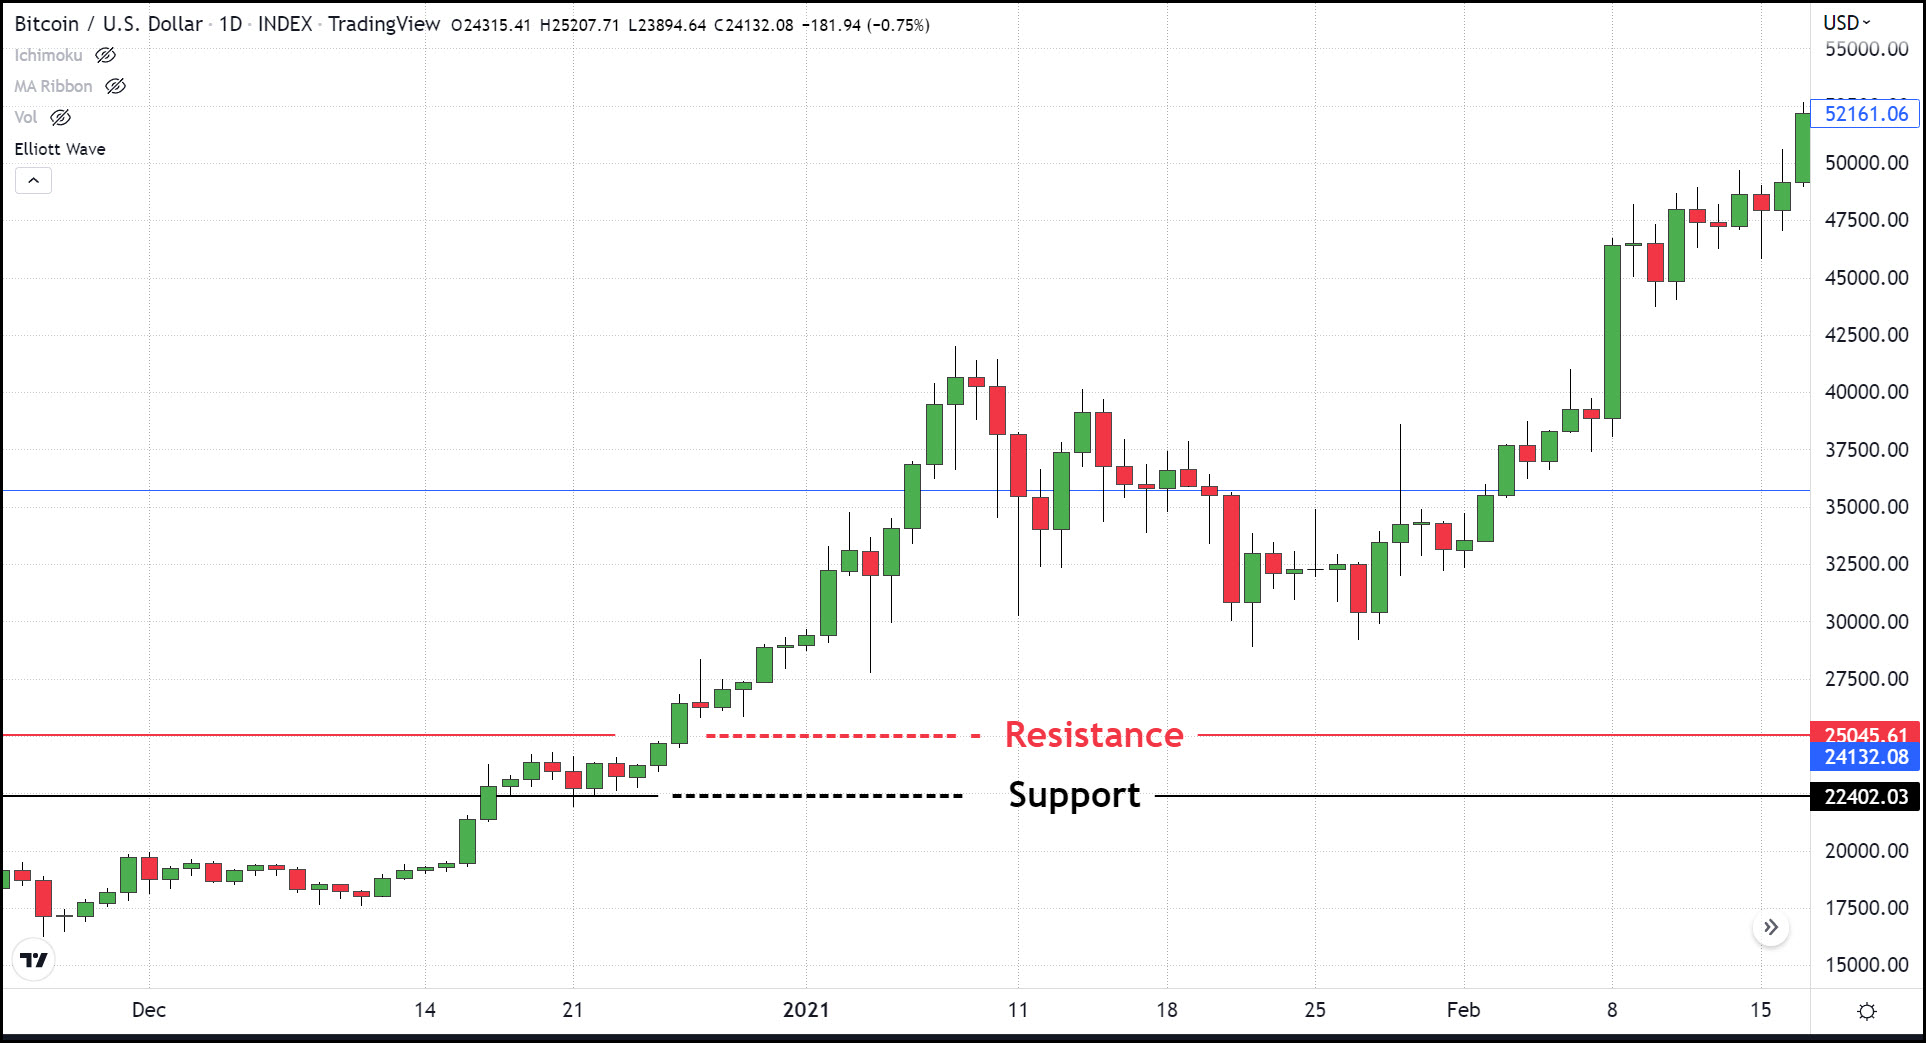
The three shooting stars that came into Bitcoin are predicting a pivot to the downside more so than a consolatory period although either is possible. The trading over the last seven days confirms that resistance at approximately $24,800 is strong. However, the support at $22,400 is also very strong. So, the path of least resistance is within the range of $22,400 - $24,800. I am expecting that we will revisit support, which is likely to hold and the subsequent bounce off of the support area should propel BTC over the current level of resistance. In other words, a pullback this week and a rally in the weeks that follow is what the charts are saying to look for. I believe the rally that follows this pullback, which I believe began today, will take Bitcoin up to $30,000 on the high side or $28,000 on the low end.
The price zone in which BTC is at right now has historically been a breakout point to a fast, steep and sudden rise during the holiday season of 2020. Two and a half years ago Bitcoin was trading in the exact same range it is currently. It entered this range on December 17th, 2020, and broke out to the upside the day after Christmas (Dec. 26th) 2020. What followed was the first historic bull run that reached heights upwards of $60,000. Back in 2020 when BTC was in the exact same range it had just made it into all-time record territory just two days prior and after exiting the range of $24k – $25k wouldn’t encounter resistance until $42,000.
The current resistance level is made much stronger by the confluence of three technical indicators as well as historical data. The first study that tells us $25k will be hard won by the bullish faction is the 100-day simple moving average (SMA) which BTC hasn’t traded above since April 20th in which the move above it was very short-lived lasting little more than a day. That last brief occurrence also happened to be at the level of $42,000, which as I spoke about in the previous paragraph was where the resistance came in following the first ever break above $25,000 in Dec. 2020.
The second study hinting at strong resistance at $25k is from Elliot wave as well as Fibonacci. The most likely wave count puts us in a “C” wave to the upside, with the multi-year lows just above $17,000 hit in June as the beginning of an “A” wave that follows a bearish zig-zag with wave 1 at the ATH and concluding Wave 5 at the multi-year lows just mentioned. That puts us in a final counter wave “C” to the upside since the lows of July 26th ($20k). Elliot Wave tells us this final corrective wave should have a relationship to counter wave “A” of 1 to 1 or 1 to 1.618. When we plot that out on our chart, we see a 1 to 1 ratio would take us to $27,400 and the more likely 1.618 ratio would take us up to $31,500. However, a .618 ratio would take us to roughly $25,000 confirming this as an important level of resistance.
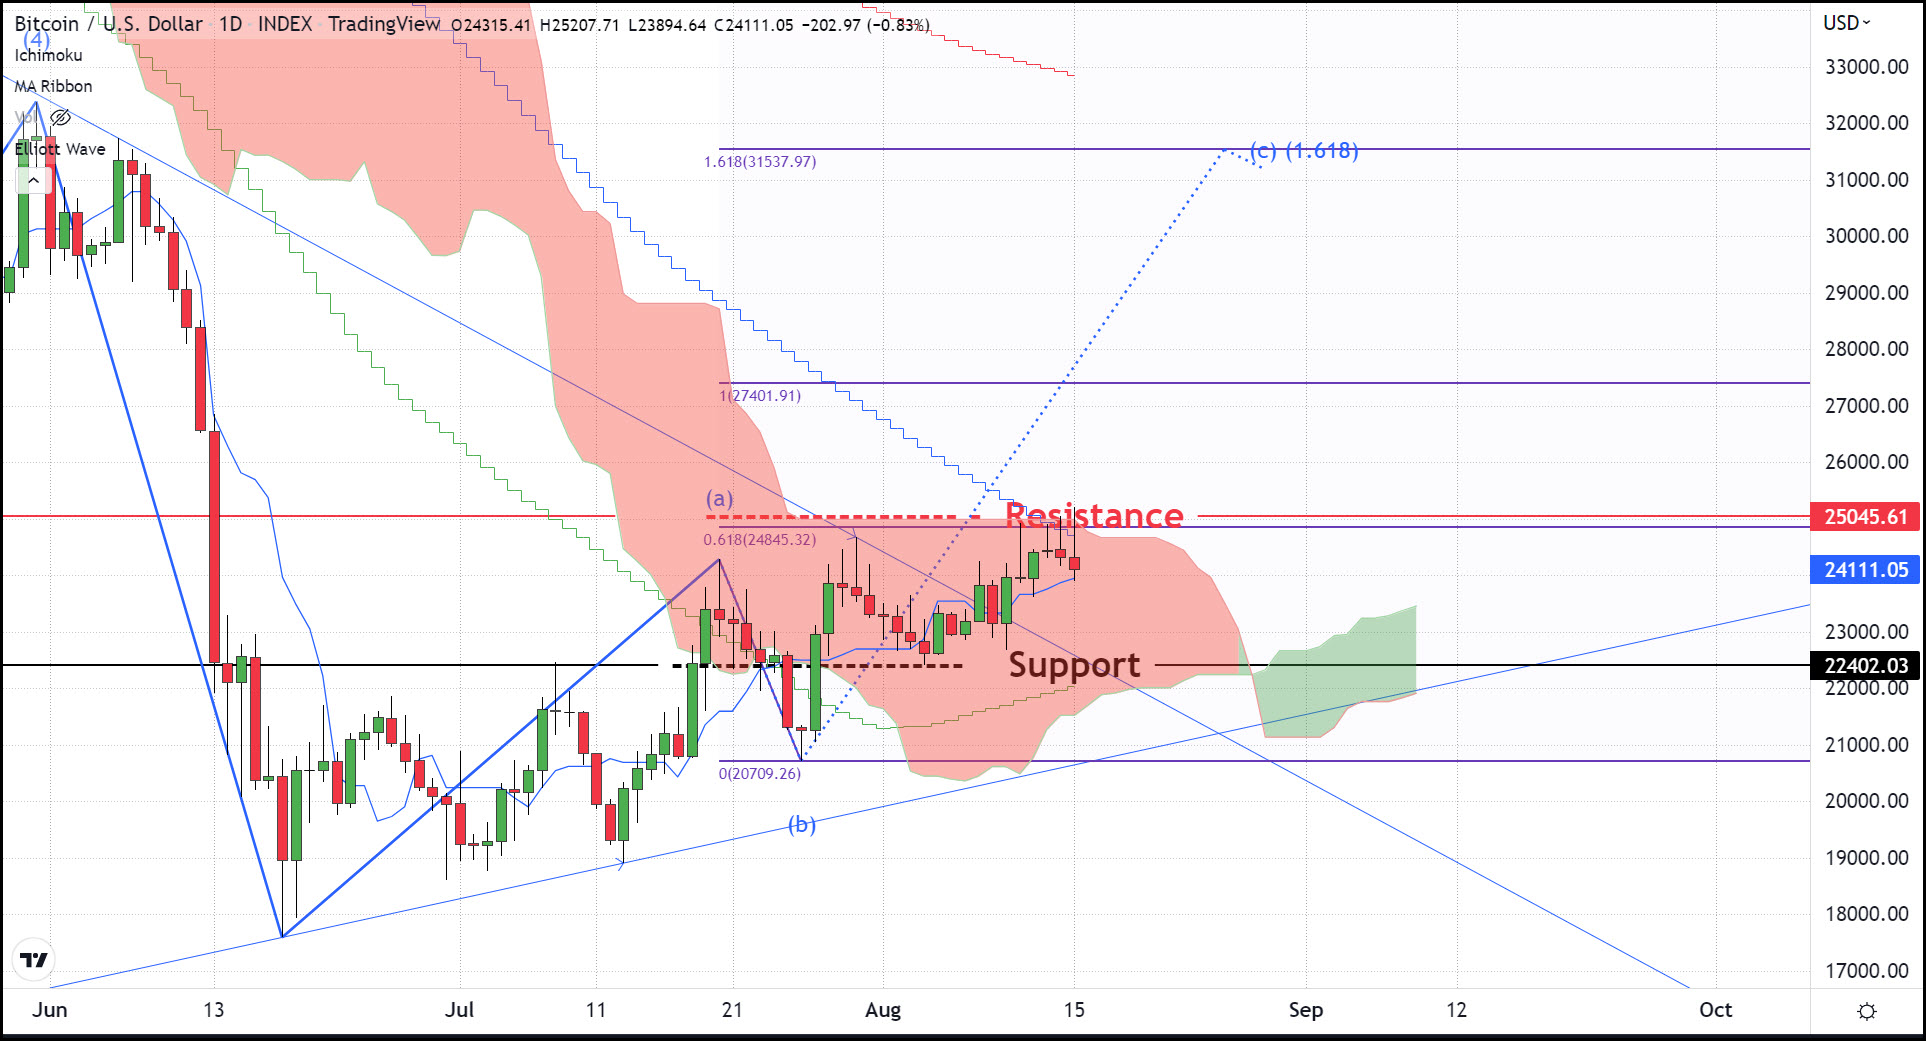
The final study that agrees with this assessment is our Ichimoku cloud. The top of our cloud is also at $25,000 and until a market breaks out above its cloud it is said to be in a transitional state.
Our forecast then has to be a re-test of support at $22,400 before moving beyond resistance and up to $27,400 - $31,500.