Bitcoin’s three unbreakable truths
On the back of more substantial losses over this last week, Bitcoin has reconfirmed its bearish trend that has now been at play for over three months. So, the question becomes, where can we look for this trend to reverse?
To answer this question, we must take a step back and look at a long-term macro view of Bitcoin since its inception. One thing we can say without a doubt and with 100% certainty is that throughout all of the parabolic rises and subsequent falls, Bitcoin has always managed to form a higher base after every one of these events. Using this one certainty, what can we expect in the coming months?
The four previous cycles
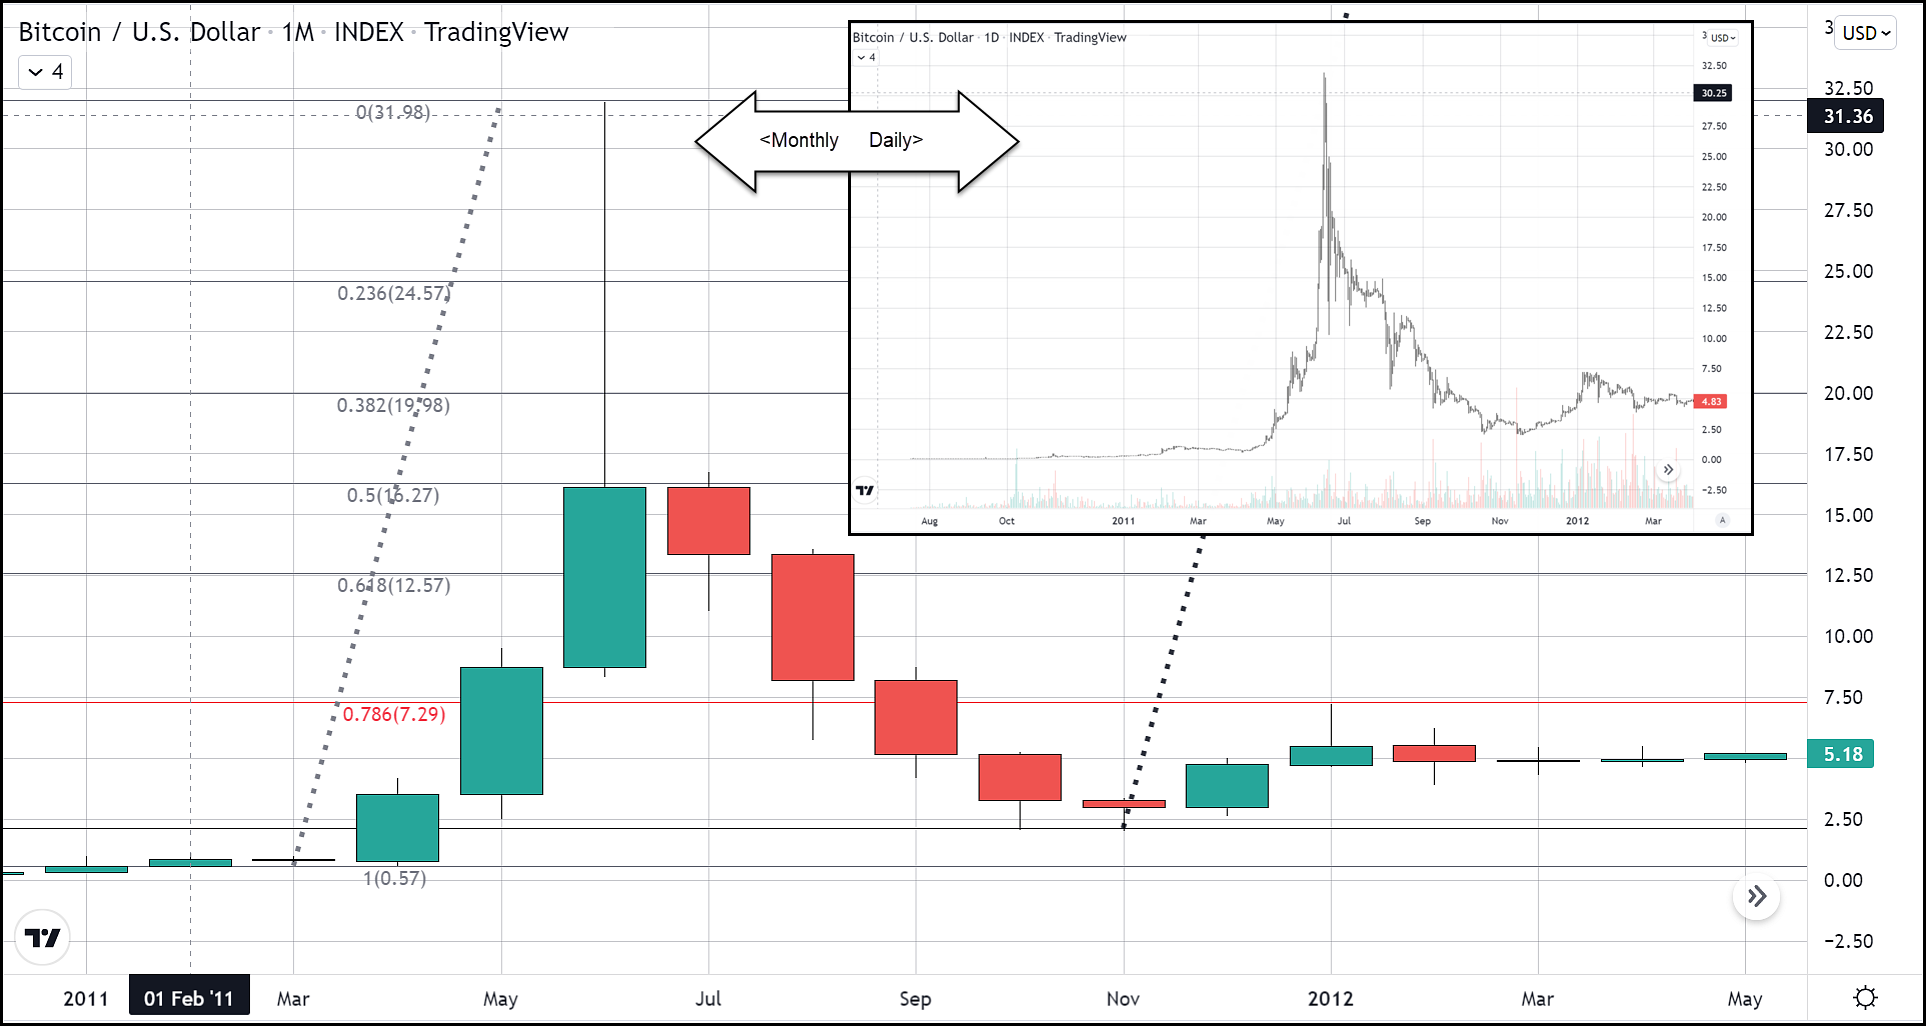
Throughout all of the four parabolic cycles so far completed, I will outline the three constant truths that define every one of them. In July 2010, prior to any parabolic moves, the bottom began at $0.01. The first parabolic move occurred in April 2011, climbing from $0.60 to $31.90 on June 8th, 2011. The fall that followed brought Bitcoin down to $2.00. Bitcoin would never see prices below $2.00 from that point on.
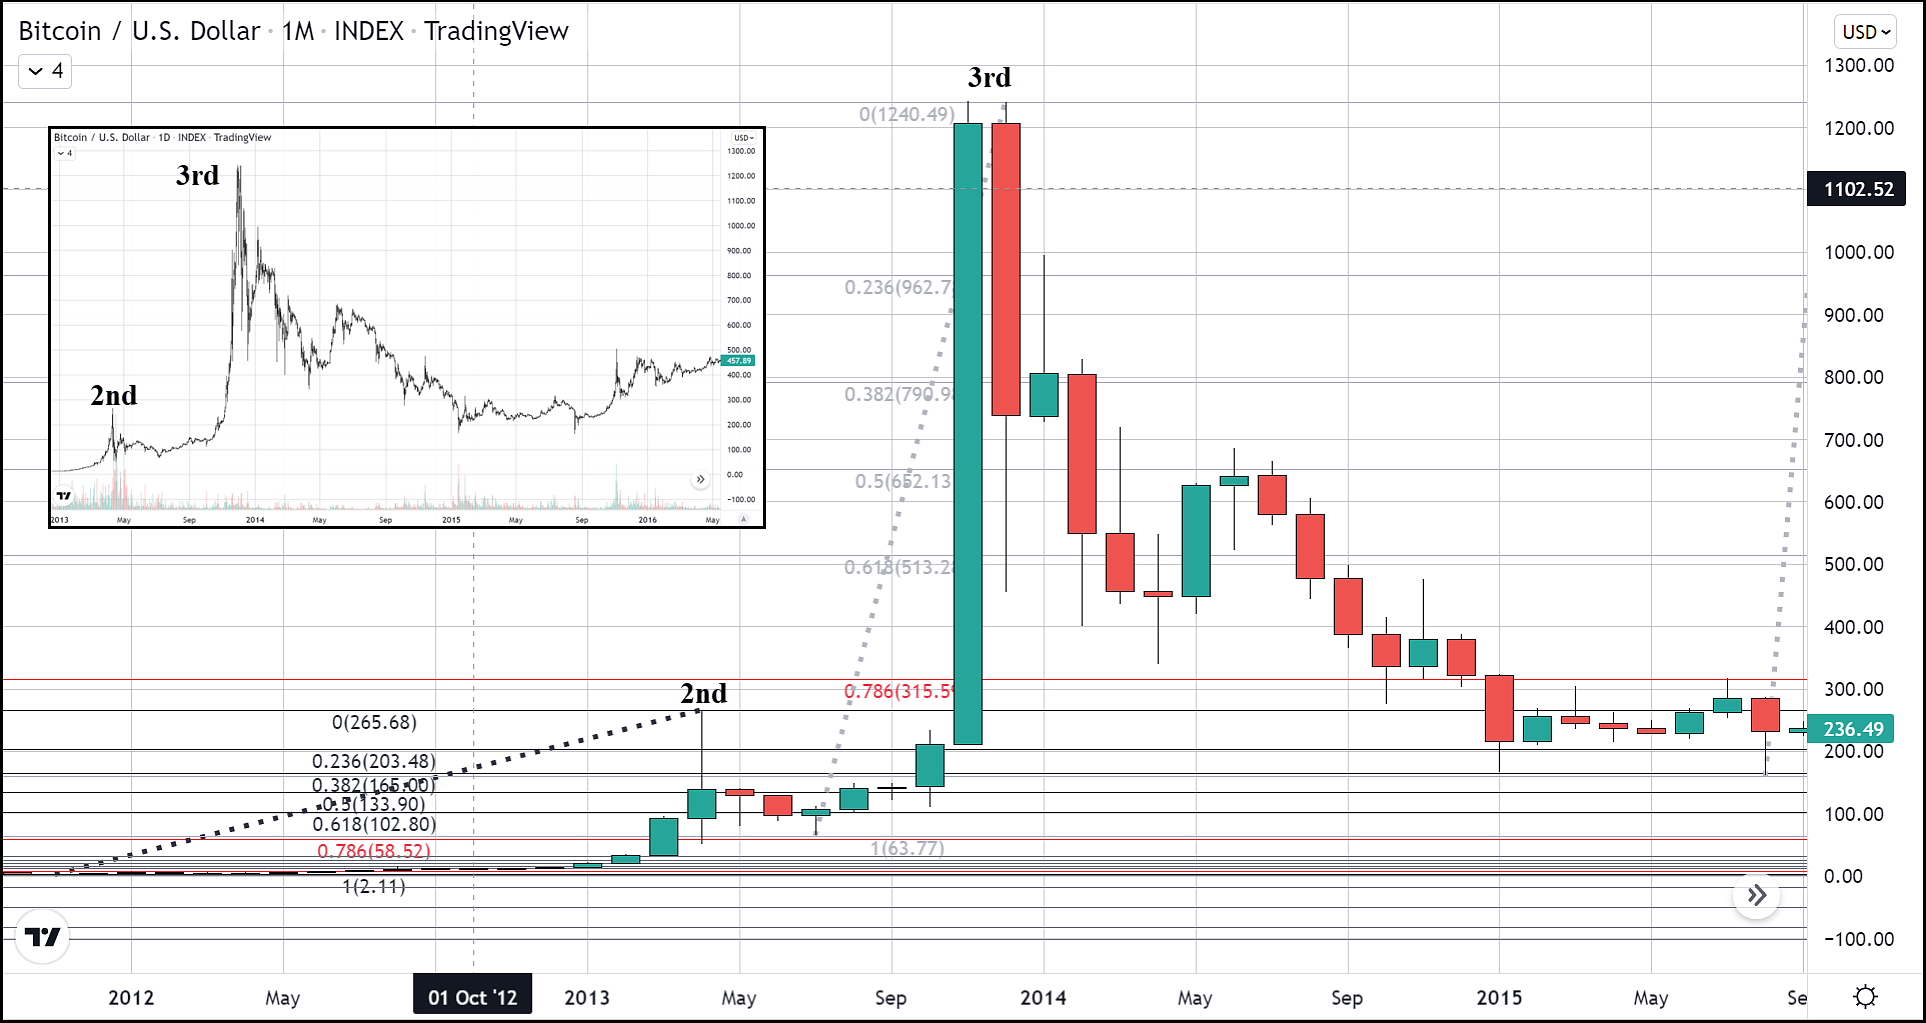
When Bitcoin made a new record in 2013 at $256, it quickly corrected, forming a bottom at roughly $63 before making yet another record high at $1,240 the same year. The correction that followed lasted over one year, creating a double bottom at $160 in 2015. Prices would never trade below $160 from that point on.
The next astonishing move took Bitcoin to a record high of $20,000 in December 2017 before falling to a low of roughly $3,000. Bitcoin would never see prices below $3,000 from that point on.
All of these amazing moves follow the same principles and contain three unbreakable truths. These principles are concrete. If they were ever to be broken, the bullish case for Bitcoin would be gone with them.
Three constants
The first characteristic evident in these four completed cycles is that pricing would go parabolic following a move beyond the previous top. This can be observed on a monthly candlestick chart, each time the last top was effectively taken out, the candle size increased dramatically. In each instance we mentioned above body size of the candles would grow to double or triple the size of the preceding candle’s body.
The second constant is that each new parabolic move produced a higher low that followed it than the previous. This is perhaps the best evidence that Bitcoin has and remains extraordinarily bullish.
The third trait passed on through each of these landmark moves is that prices retraced at minimum 78% of the move to the upside following these historic rallies. It is this constant that I am using to draw my conclusion to the question I posed, “Where can we look for this bearish trend to reverse?” Based on everything stated in this article we have to believe that the current downtrend has not yet concluded.
The fifth iteration
We are in the midst of the fifth of these parabolic cycles. The first rule has already been met when in December 2020, we traded above the previous record high ($20,00), and the monthly candle doubled in size. However, the final two characteristics point to the possibility that Bitcoin has yet to fully correct from the current record high in the market. For these constants to continue to hold the truth they held since Bitcoin’s emergence into our world, both financially and philosophically, we would expect to see the current correction that has been underway for over three months to conclude at a price no higher than $18,000 and no lower than $3,000.
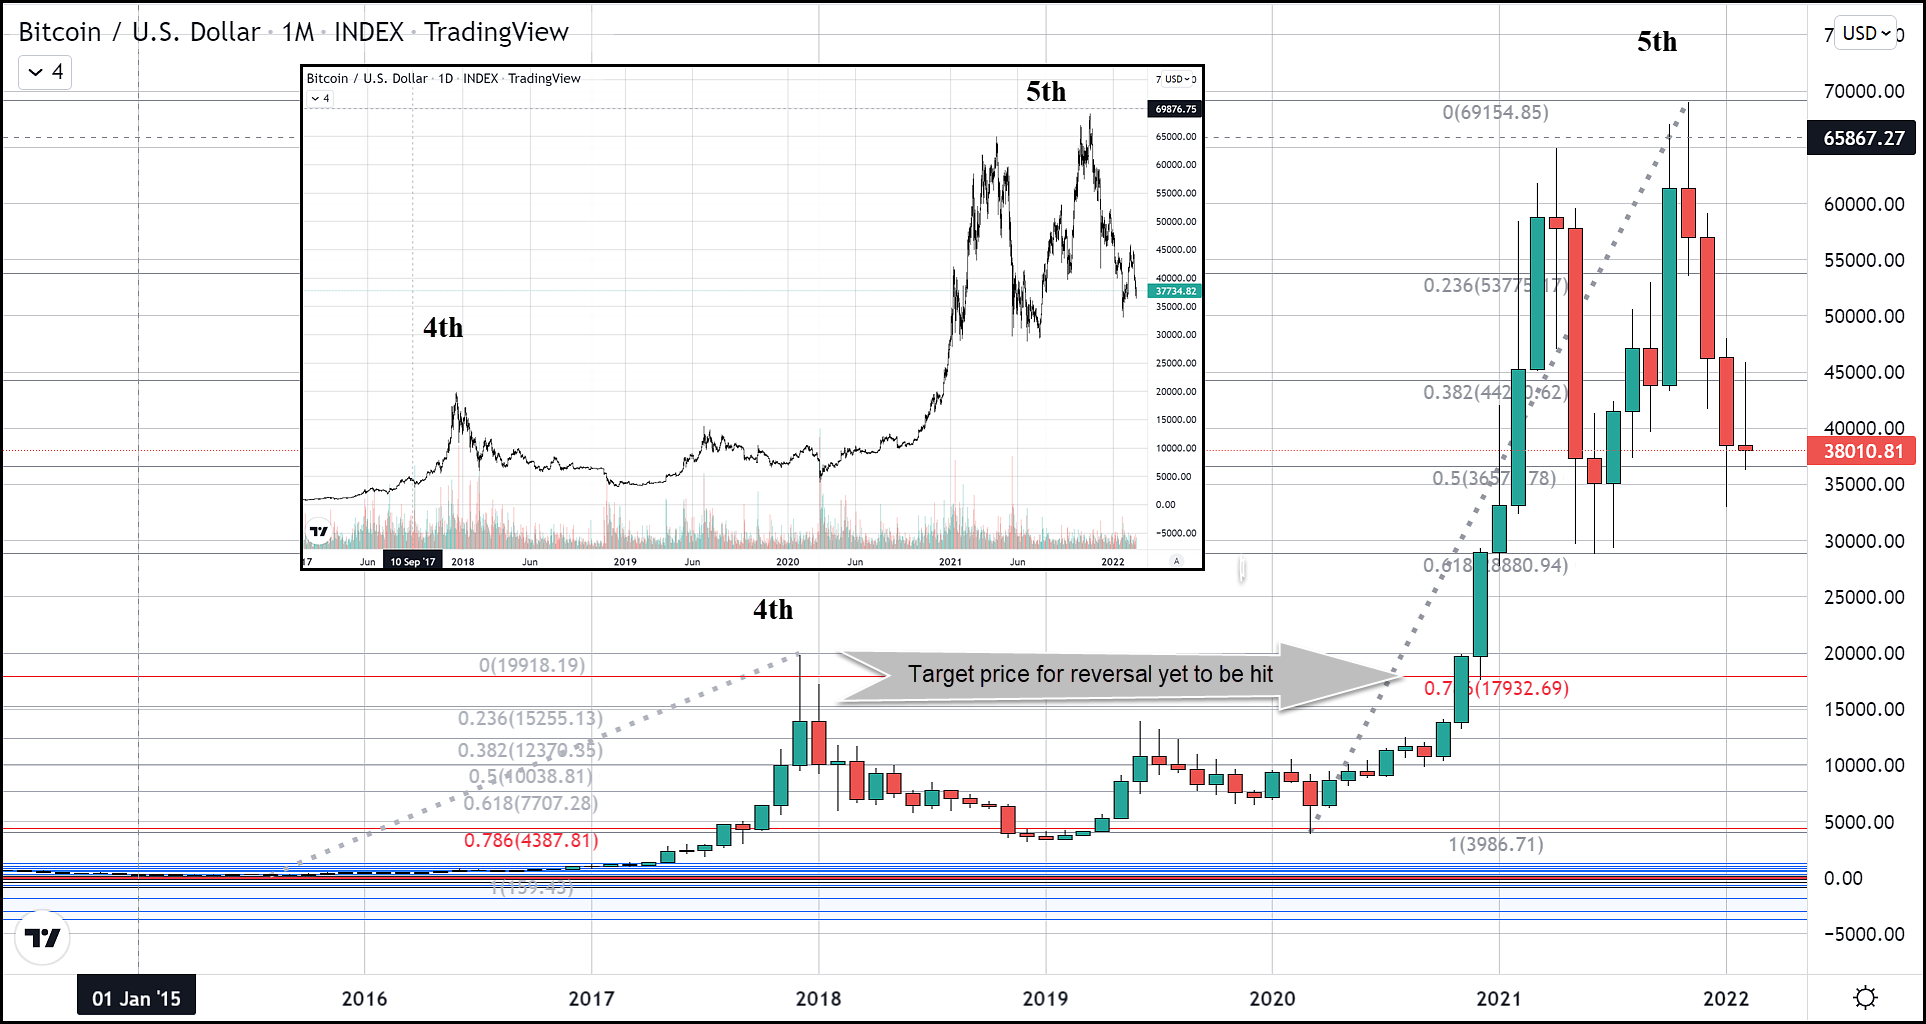
I haven’t heard anyone calling for these prices, including myself. But taking a step back to view the fundamental laws Bitcoin follows better than any other market, the traits which drew me to Bitcoin in the first place, we have to assume lower pricing is ahead. No other scenario can occur without Bitcoin entering into an entirely new phase, at which point it would lose its bullish foothold and the magic that made it what it is today.