Hard-fork in the road

As of 5:30 PM Eastern Standard Time, yesterday Bitcoin was trading at approximately $38,775, gaining almost 1% on the day and 5.7% higher on the week. Although this week’s relief rally appears to be a turning point in the markets, when looking at the bigger picture, the gains this week across-the-board in most crypto’s is nothing more than bargain-hunting. Traders are buying coins not because of their short-term prospectus but rather the nearly 50% discounted prices on coins of all types and market caps. Solana (SOL) is up over 20% on the week but has a long way to go to get back to previous levels. Even with this week’s gains, it is down over 30% for the month, losing nearly half of its value when SOL fell to a low at $90 after starting this month at approximately $180. This theme of playing catch up after dramatic losses is echoed throughout the entire crypto sector, creating many profitable opportunities for short-term traders.
Bitcoin’s current rally is largely due to traders simply buying the dip and is likely to fizzle out before making any major price advances, such as taking out resistance at $44,000. As such, the number one crypto by market capitalization can still be characterized as stuck within a descending top. As we have spoken about on several occasions over the last month this descending resistance matches the slope precisely of BTC’s first crash from $65,000 in the summer of 2021. The gradient of the upper descending trendline is extreme, with a pitch of approximately -75°, with last summer’s upper resistance line having a slope of -73°.
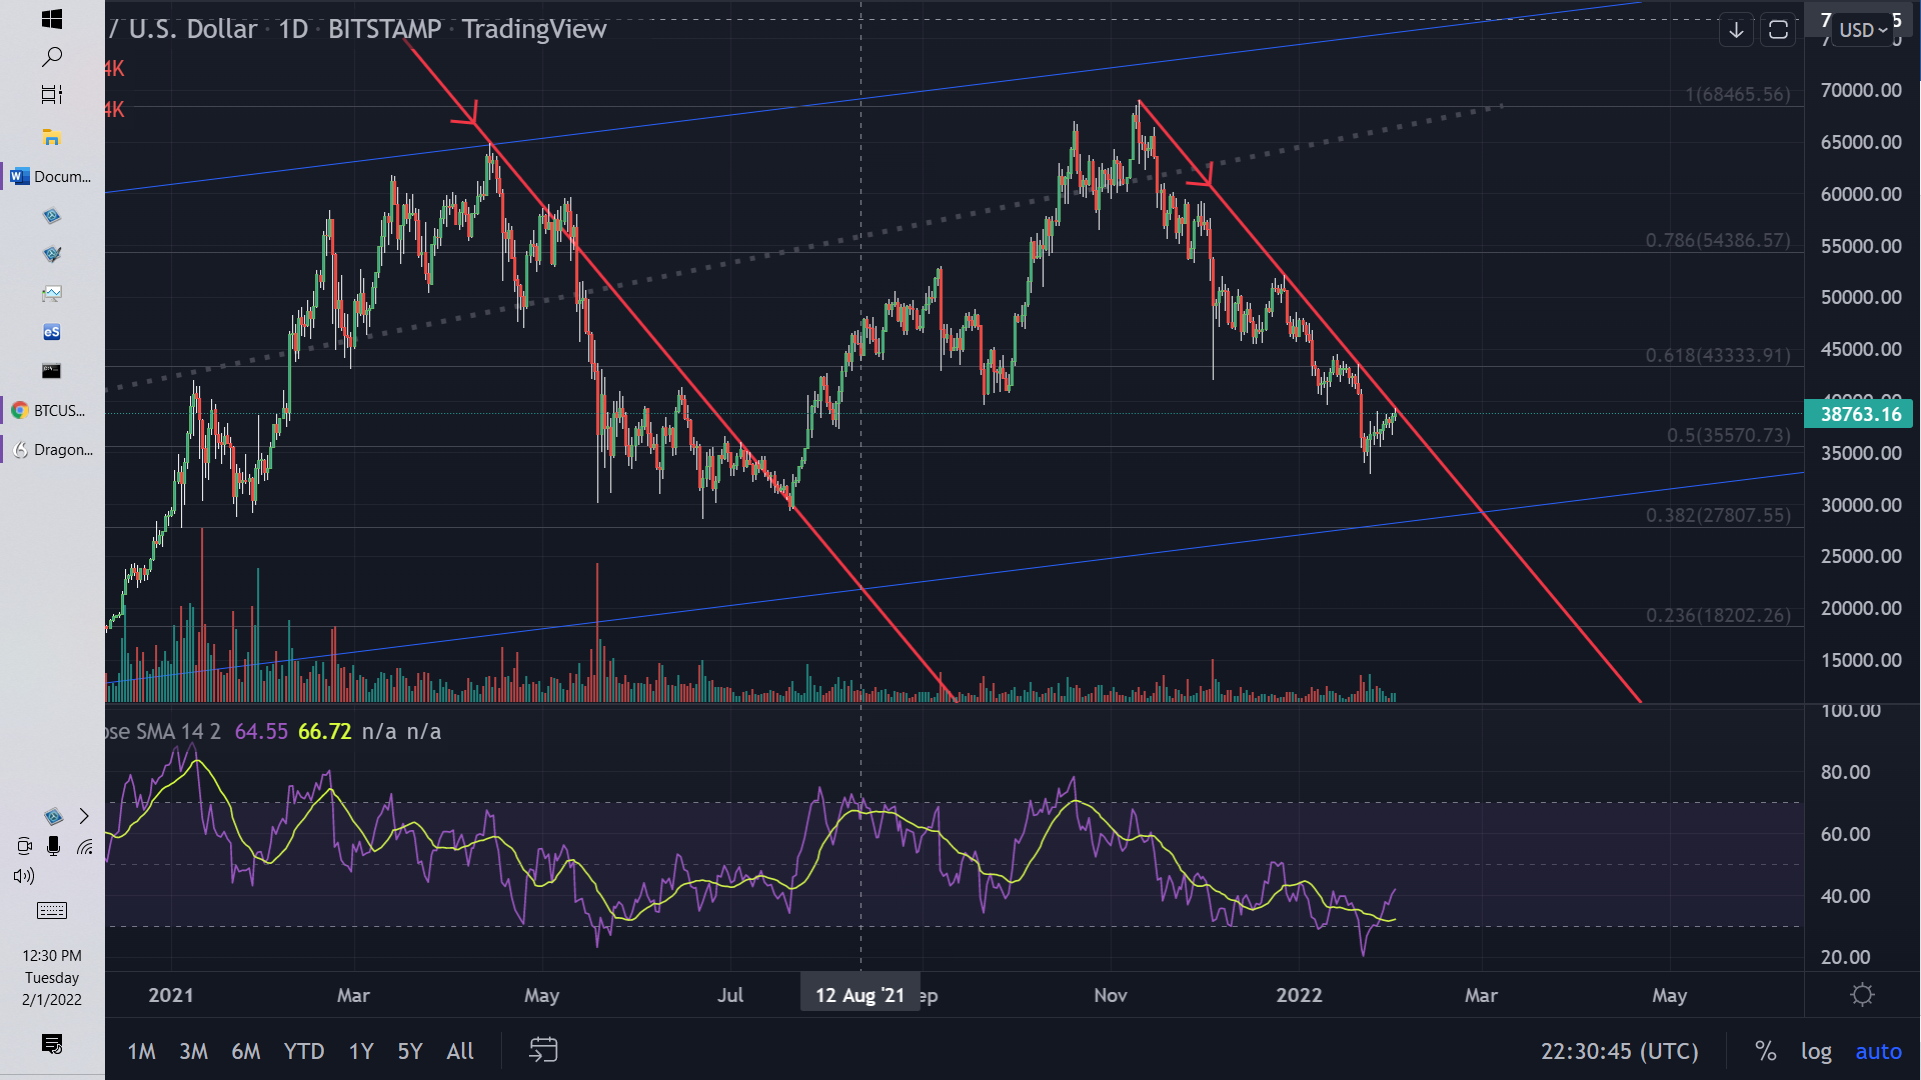
When we compare this to the descending top that lasted from December 2017 up until July 2020, the descending trendlines couldn’t be further apart in terms of taper. The multiyear top that began in 2017 had a slope of only -7°.
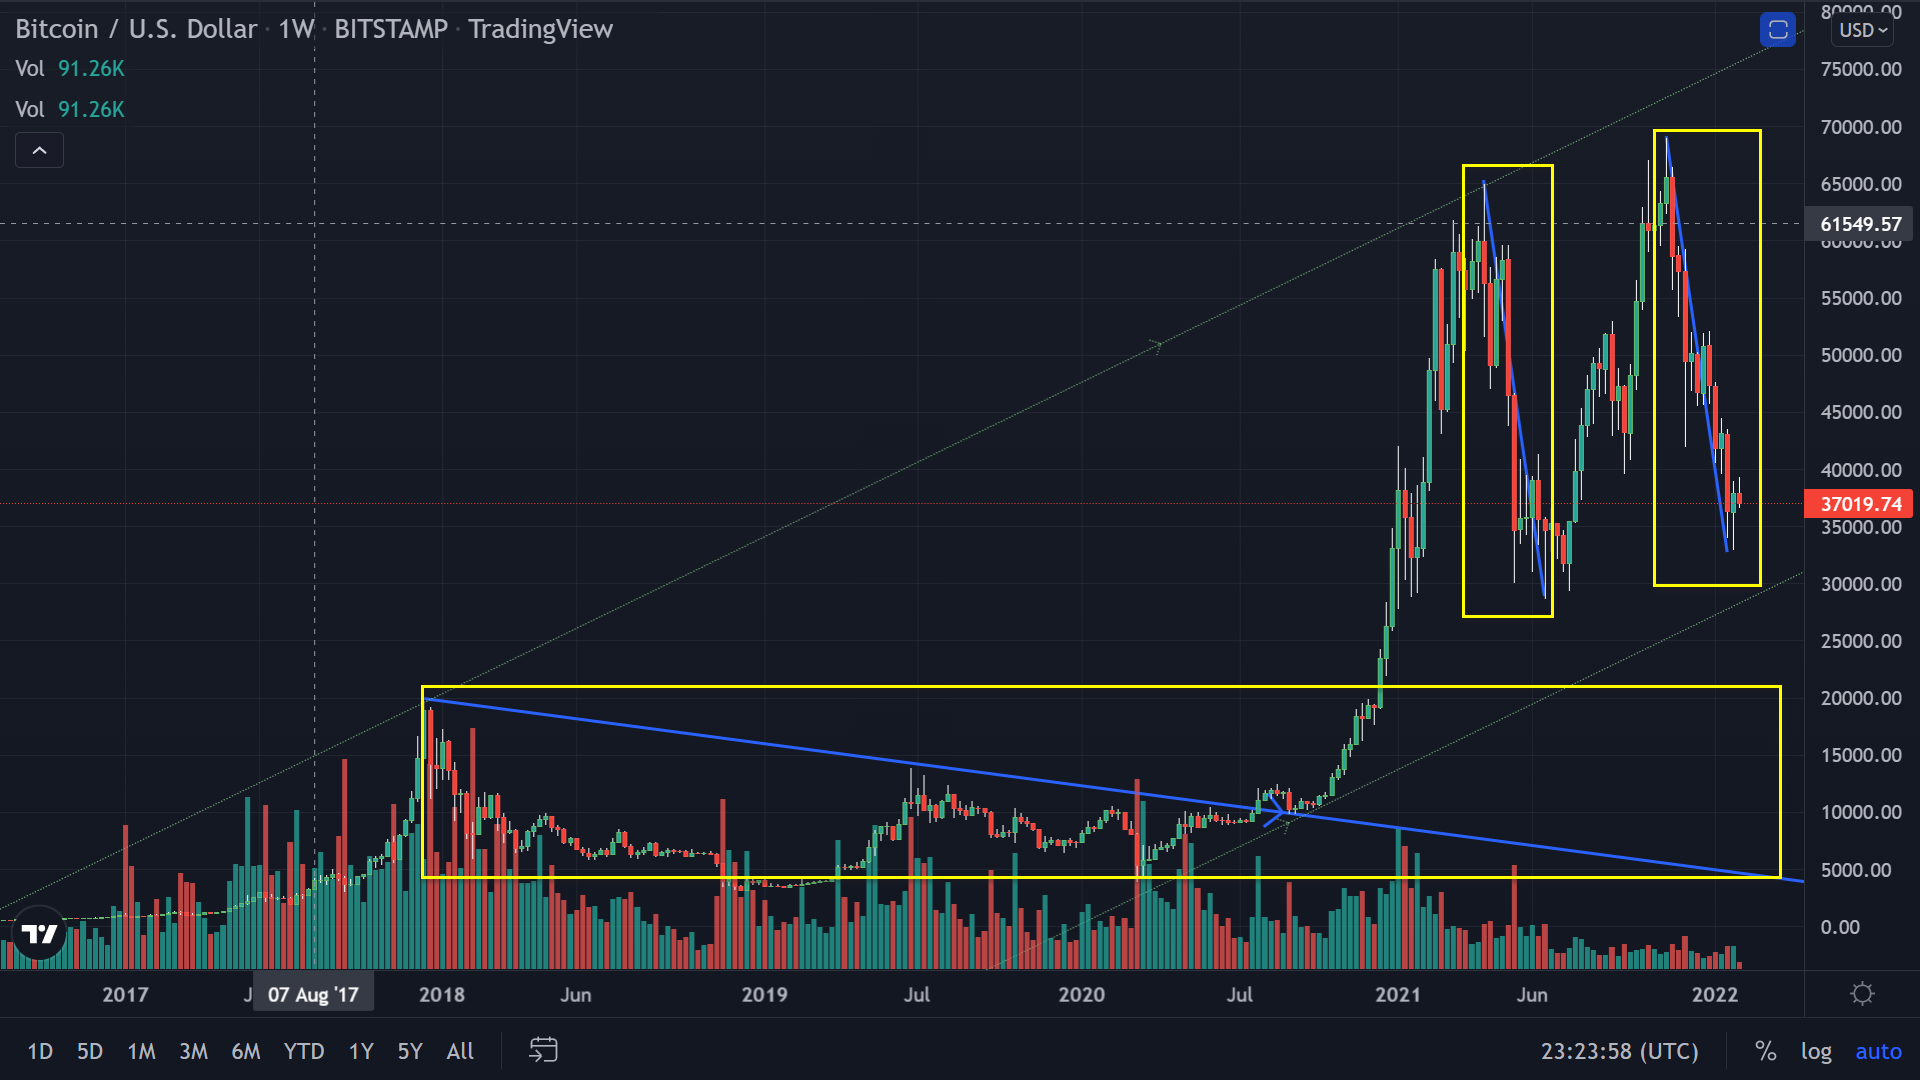
It is apparent that bitcoin has not shed its volatility over the years as many have hoped it would rather it has picked up steam, dramatically increasing in intensity all while trading volume slowly erodes on a weekly basis.
We have arrived at the crossroads
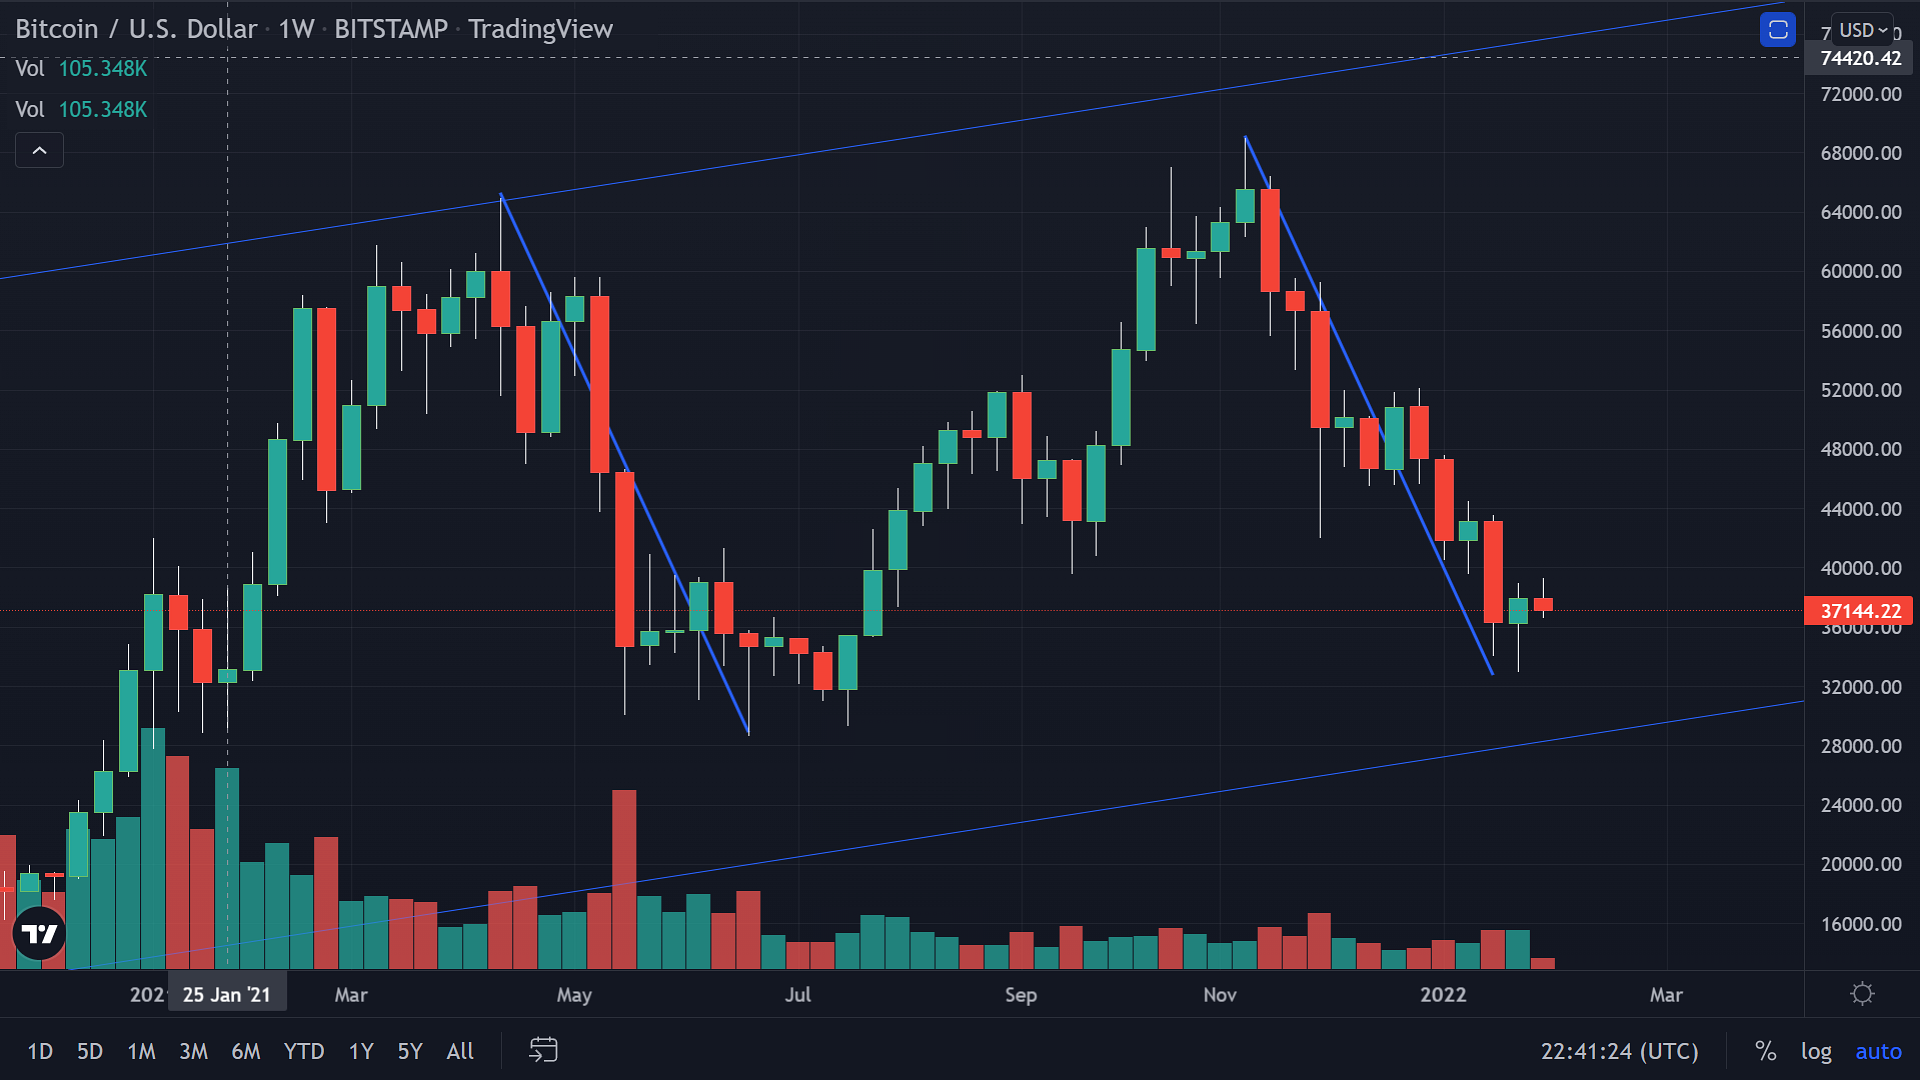
Bitcoin is at a figurative fork in the road. It has lost 55% of its value from the highs in November, precisely the same amount it fell after hitting $65k in April 2021. It shed this $36,000 of value in roughly the same time as it did in 2021 of 70 days. The low hit last week represents a 1 to 1 move from the fall to 29k and the subsequent recovery.
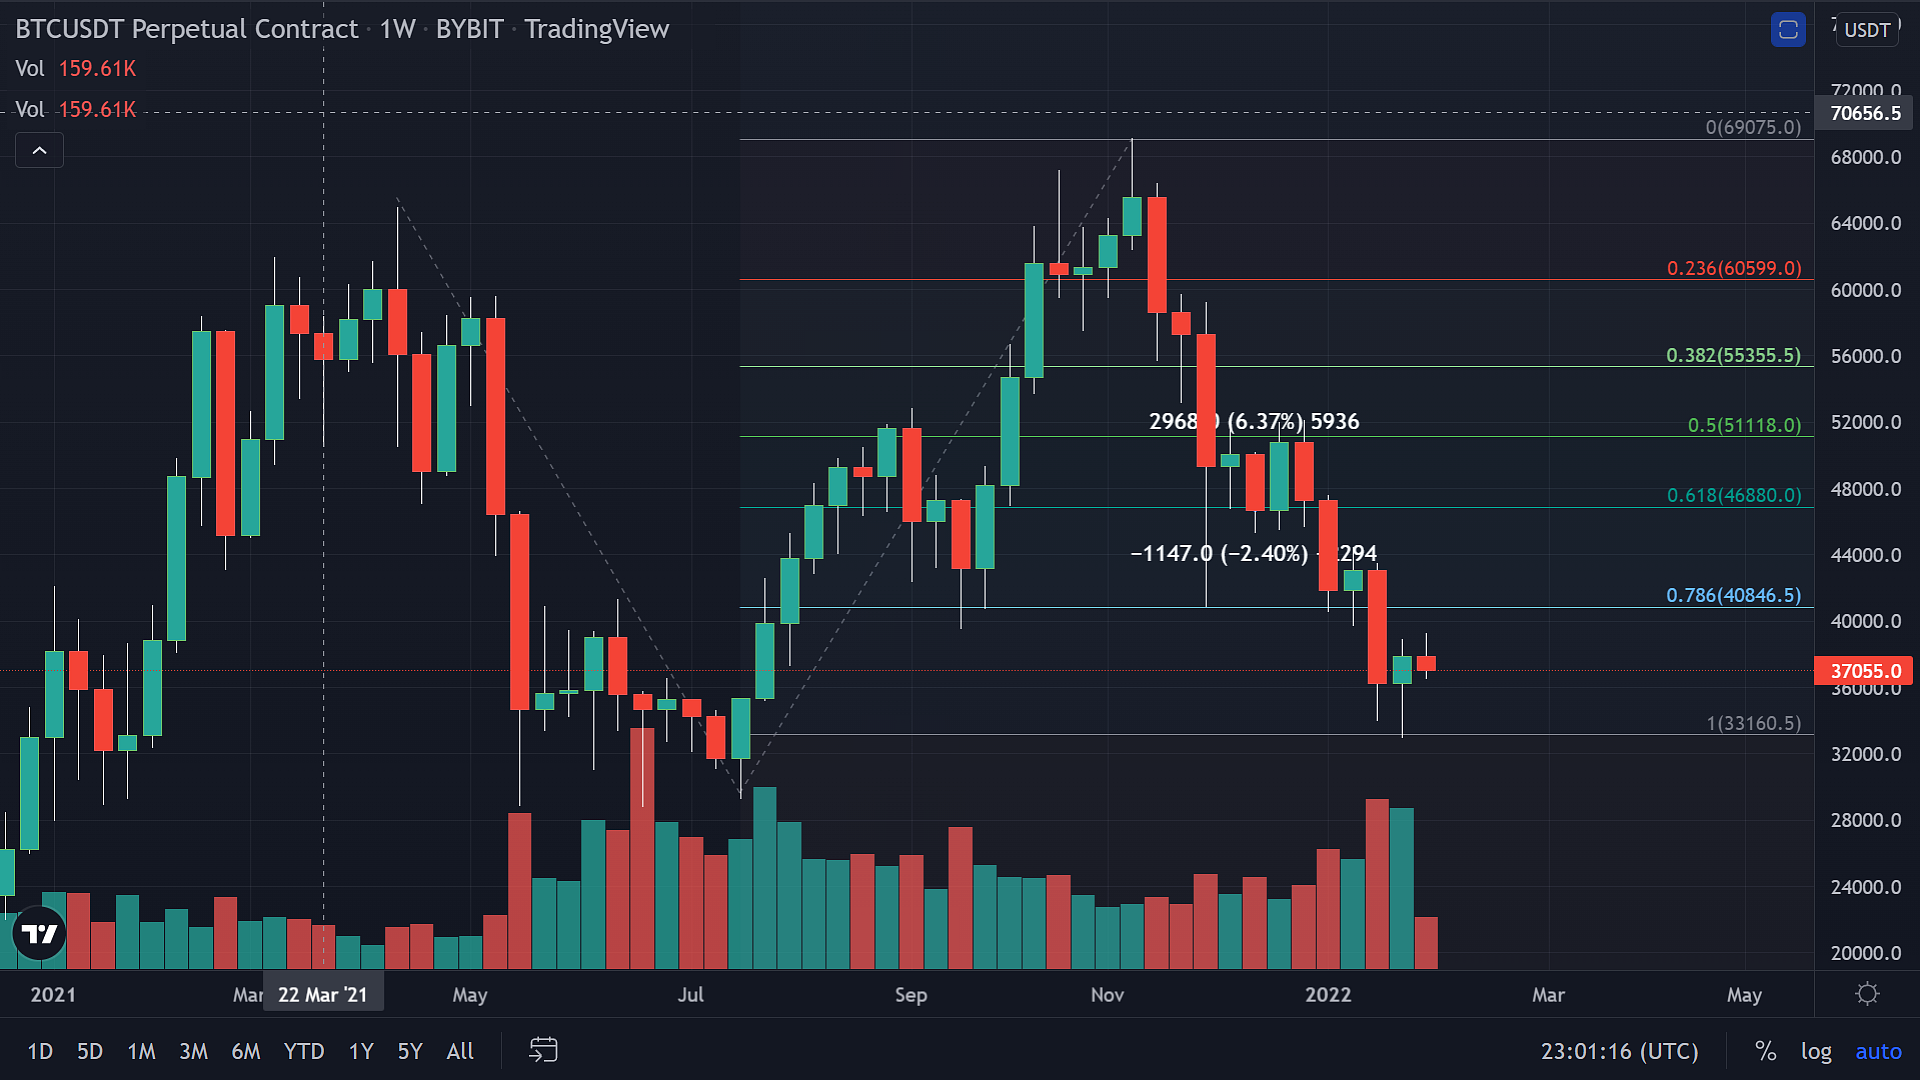
Looking at the Trend-based Fibonacci extension in the chart above, it becomes clear that at every level (.236, .382, .5, .618, .786) in this extension served as support, resistance or both. This makes this particular extension worth paying attention to, and what it is saying is that $33,000 has to hold or we will be entering a new range and era for Bitcoin, and the cryptocurrencies follow it with obedience.
Another study we discussed last week was the ‘head and shoulders’ pattern appearing in Bitcoin and if prices fall below the neckline at $30,000, that would be calling for much lower prices and could signal an end to the overall bull market that existed for over two years.
However, after the identical crash in summer 2021, a parabolic rallied swiftly brought the digital asset to a new all-time high. So, we need to pay close attention to how bitcoin acts over the next month, especially regarding the bottom at $33,000 and the neckline at $30,000. For these reasons, Bitcoin is at a crossroads and even with all the bearish sentiment and action of recent, if anything can come back from underdog to overlord, it is Bitcoin, and it isn’t over until the Fib. level fails.