Head and shoulders pattern in Bitcoin
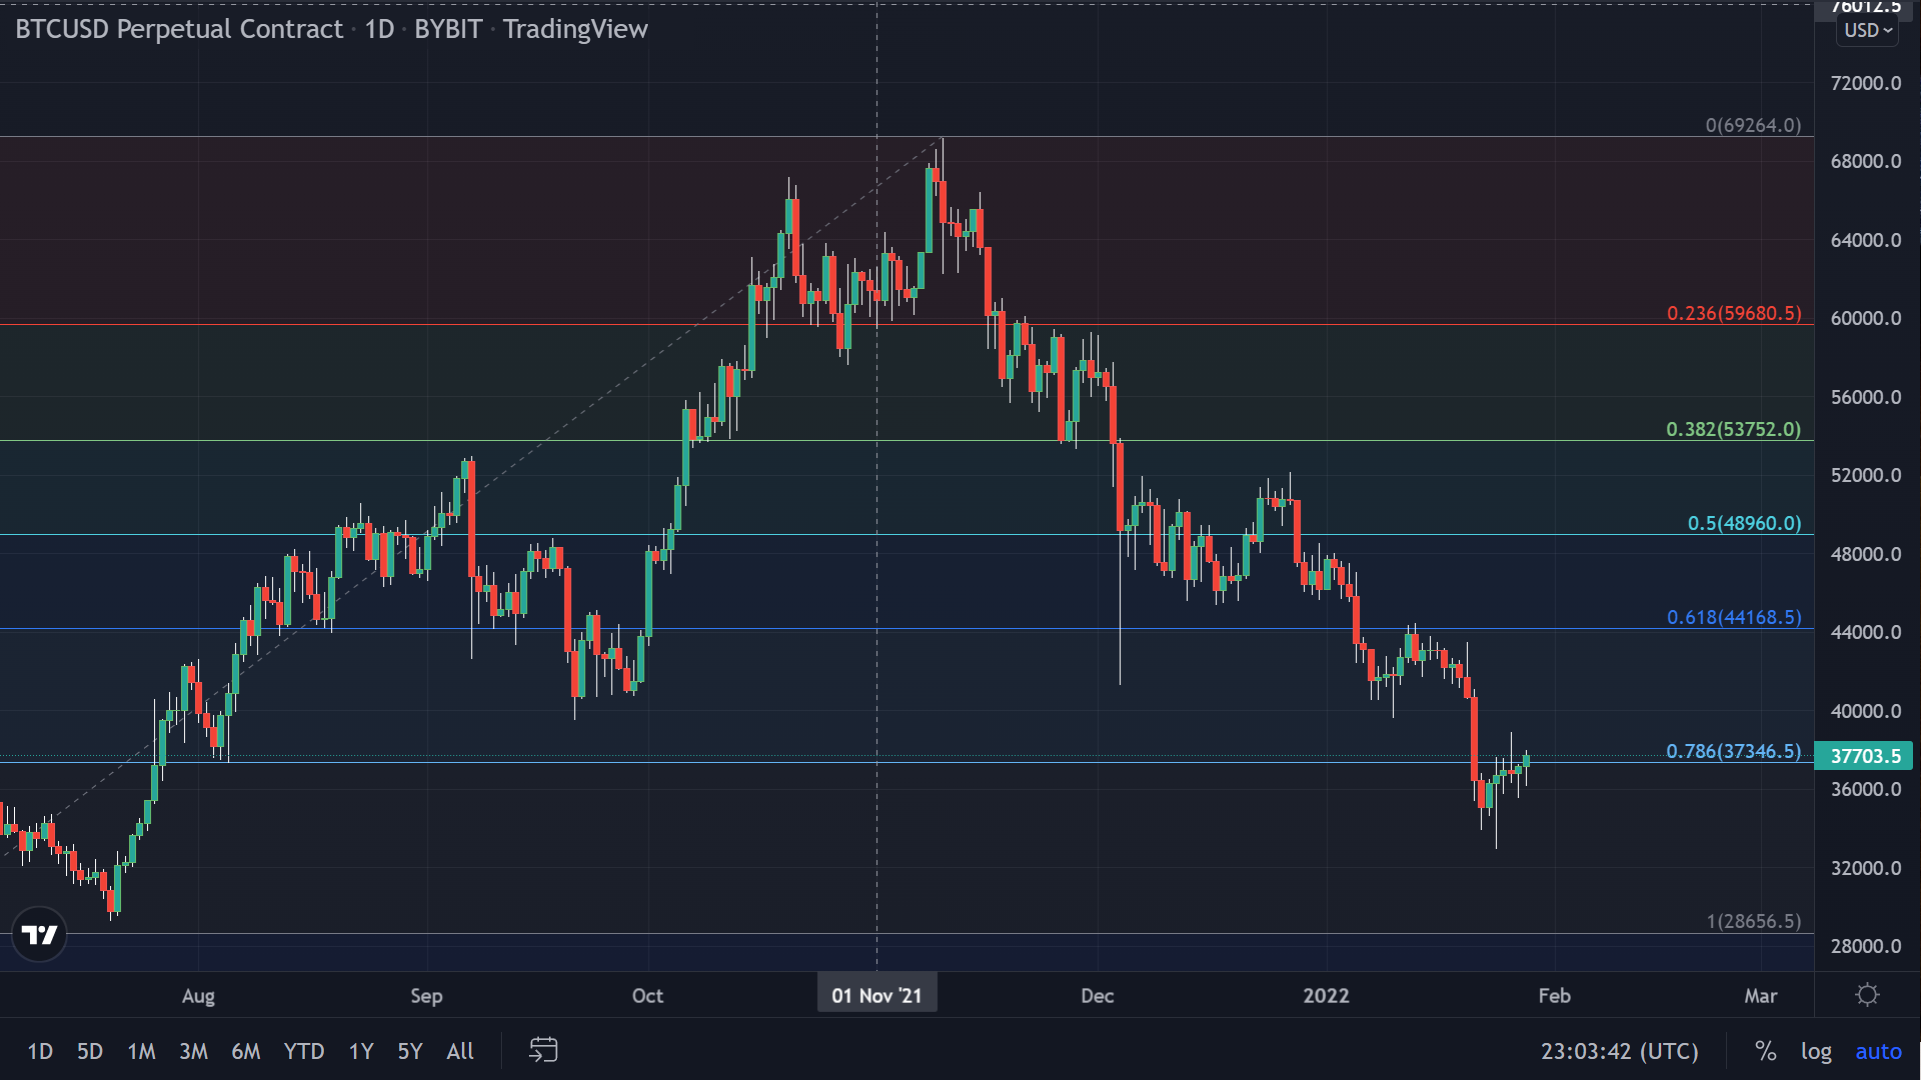
One of the most reliable patterns in determining a reversal from bullish to bearish is known as a “head and shoulders.” One has clearly formed in Bitcoin and could signal a revisit to the $30,000 level.
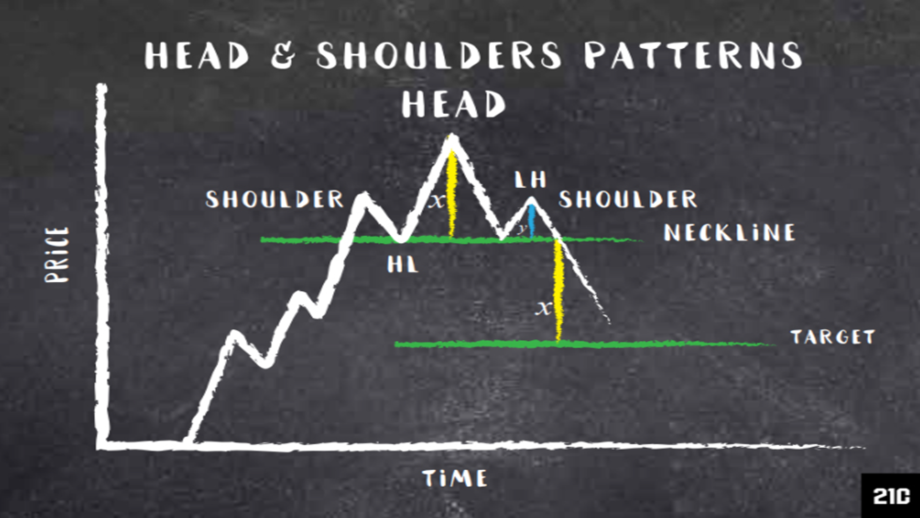
Investopedia says this about the formation, “A head and shoulders pattern is a chart formation that appears as a baseline with three peaks, where the outside two are close in height, and the middle is highest. In technical analysis, a head and shoulders pattern describes a specific chart formation that predicts a bullish-to-bearish trend reversal. It is one of several top patterns that signal, with varying degrees of accuracy, that an upward trend is nearing its end.”
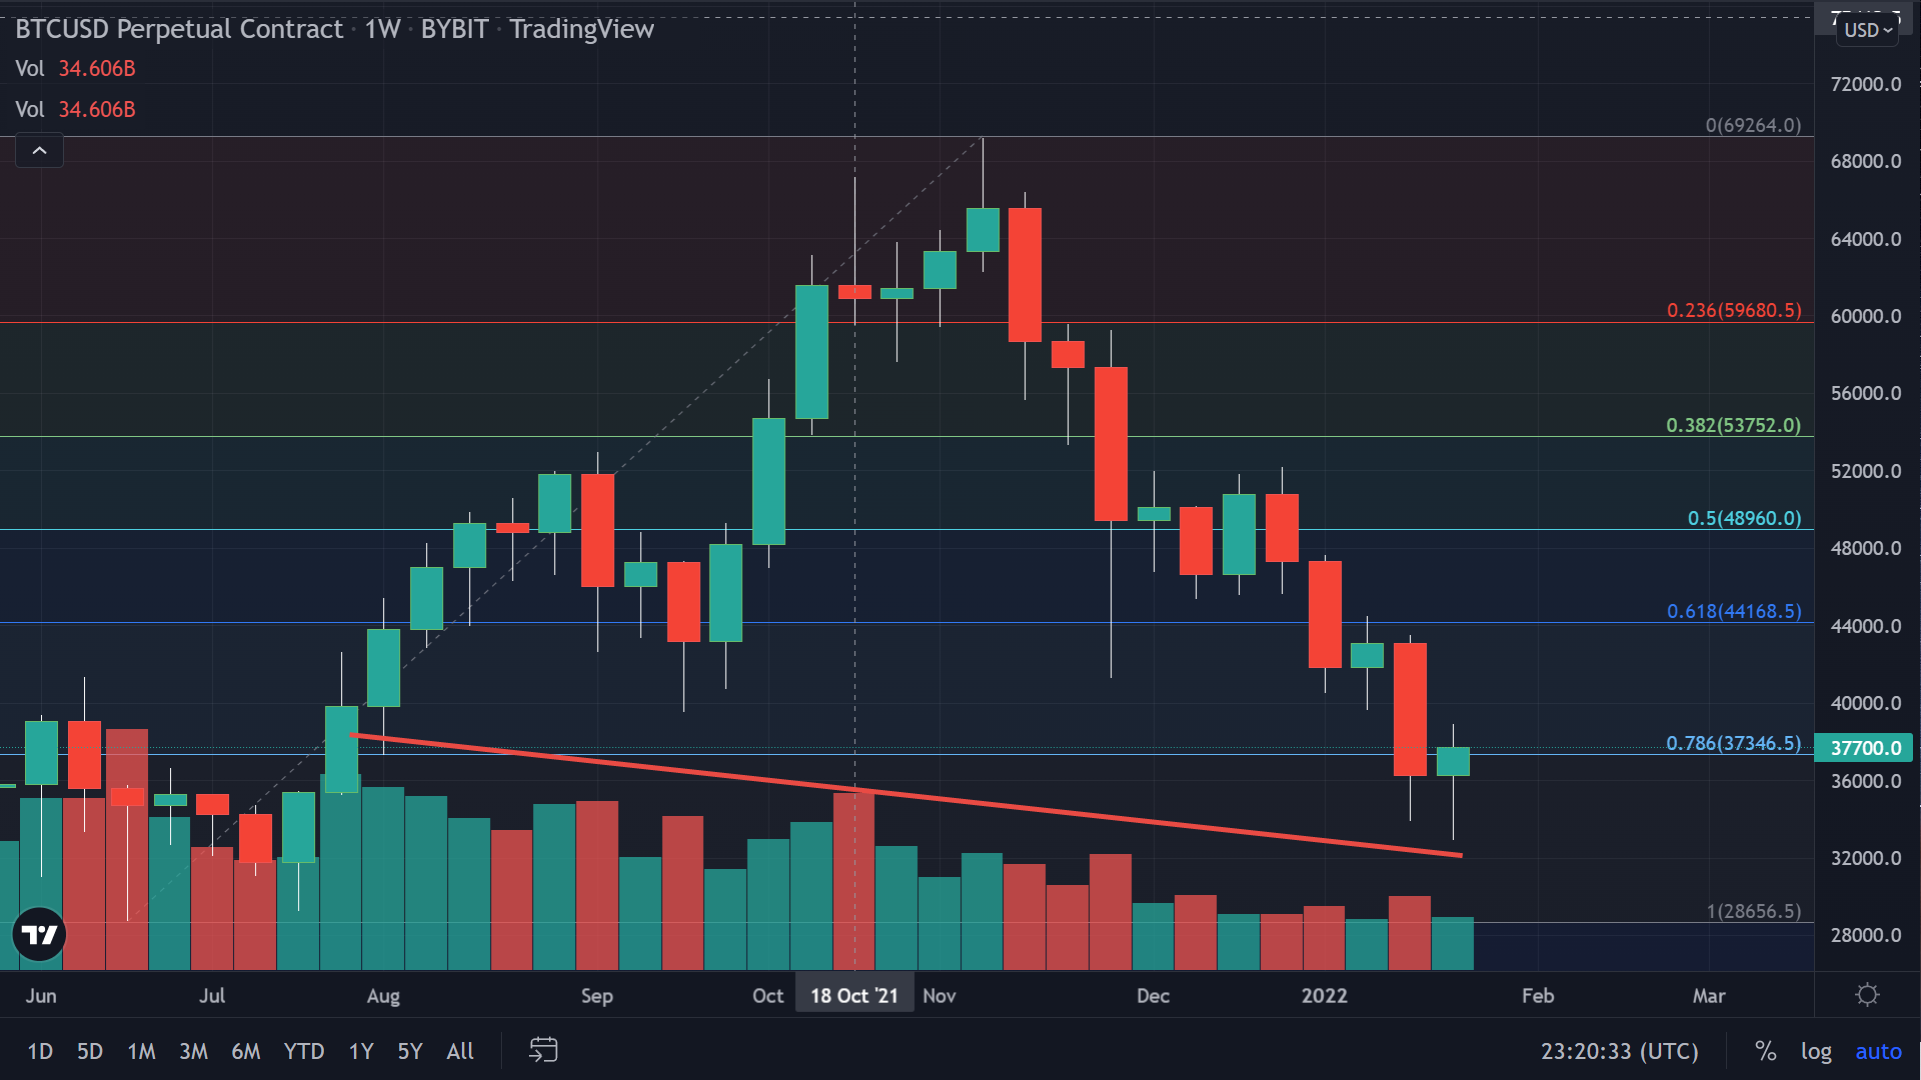
Along with the formation of the three peaks needed for a head and shoulders pattern to be acted upon and taken seriously, there must also be a decline in volume, starting out higher during the left shoulder and sloping down from that point. Bitcoin’s volume surely fits this parameter also and can be seen on this weekly chart below.
This pattern so clearly illustrated in Bitcoin is undoubtedly calling for lower prices. Possibly even pointing to a break below $30,000. A re-testing of support at that area at minimum.