Study shows the bottom may be in but 200-week SMA says otherwise

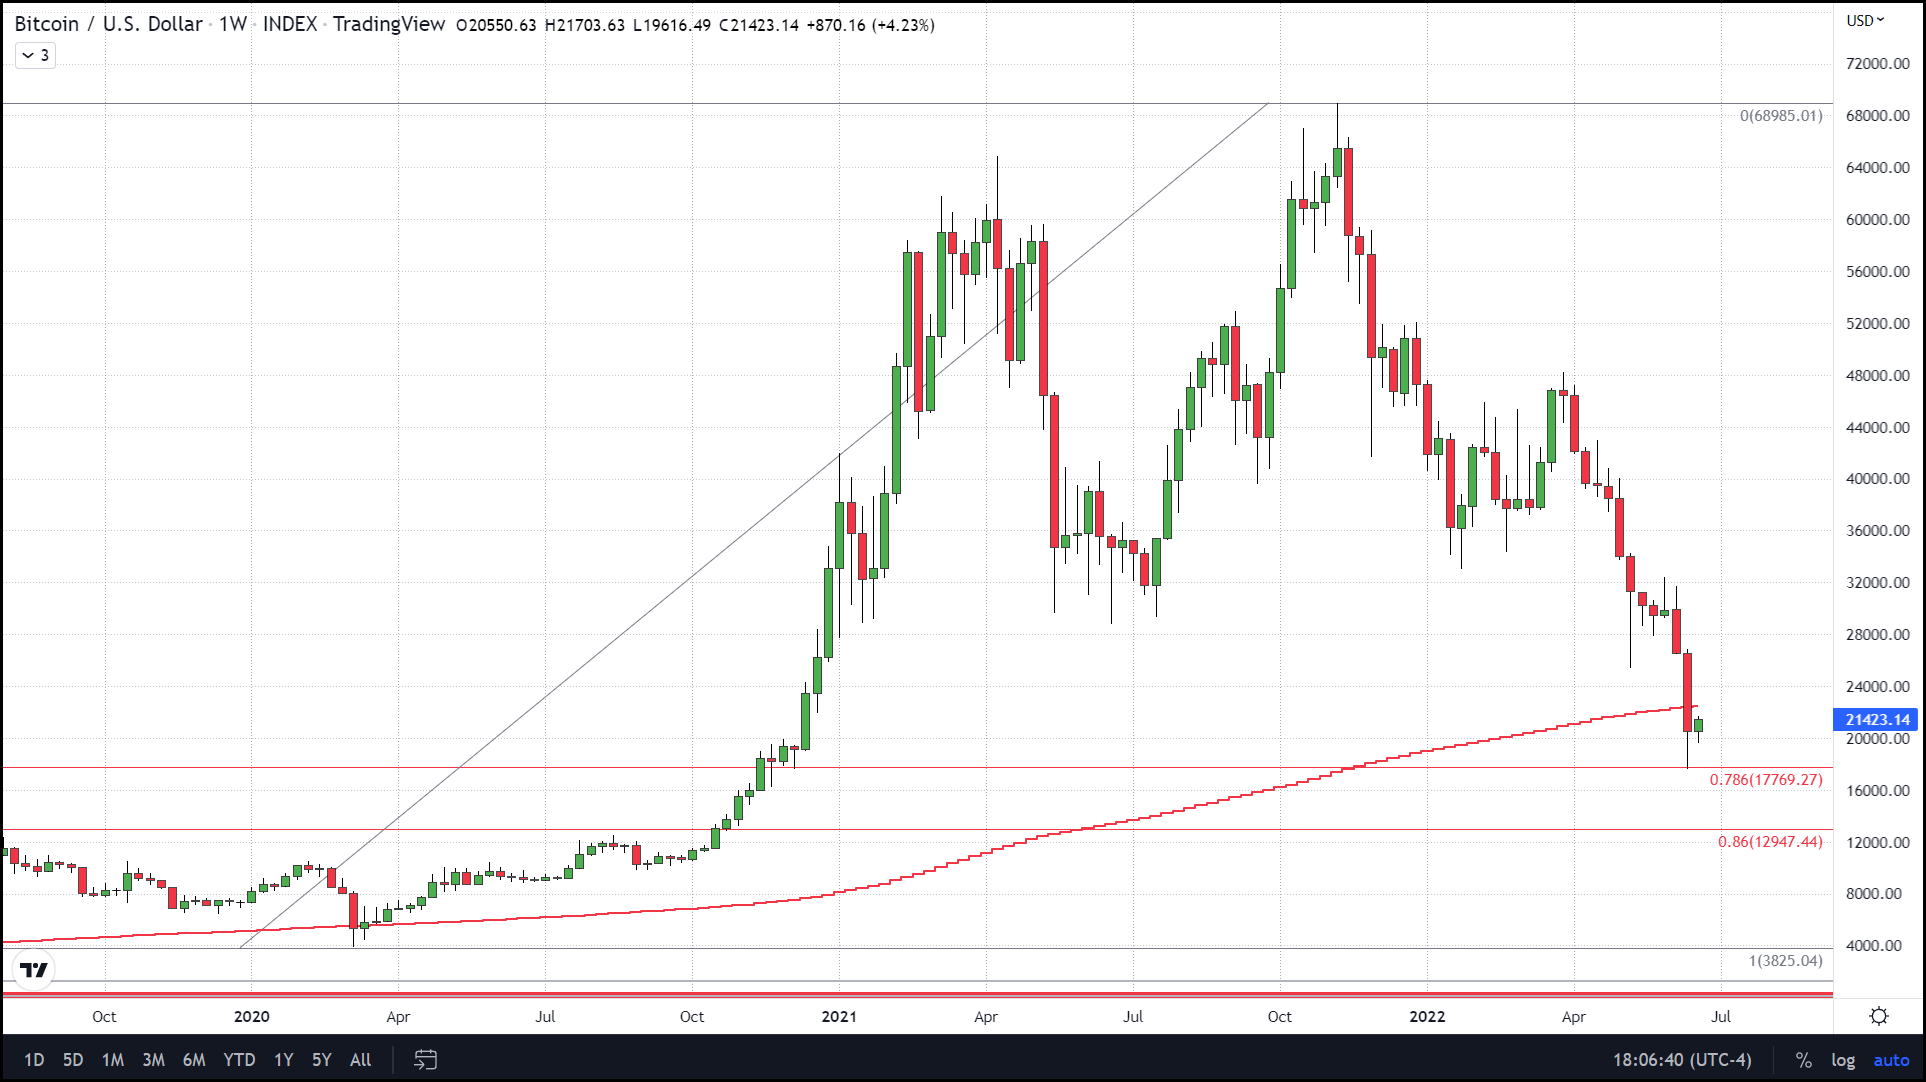
Bitcoin seems like it could have made its bottom seeing as it did hit our minimum target of $17,770 which represents the 78% retracement and has had a slight bounce off that level. The retracement used stretches from the lows of the covid crash ($3,825) to the all-time high ($69,000). We have noted on several occasions that every parabolic move in BTC’s history was followed by a 78% - 86% retracement. This has always been a technical requirement for BTC that has to be met before the next parabolic rally could begin.
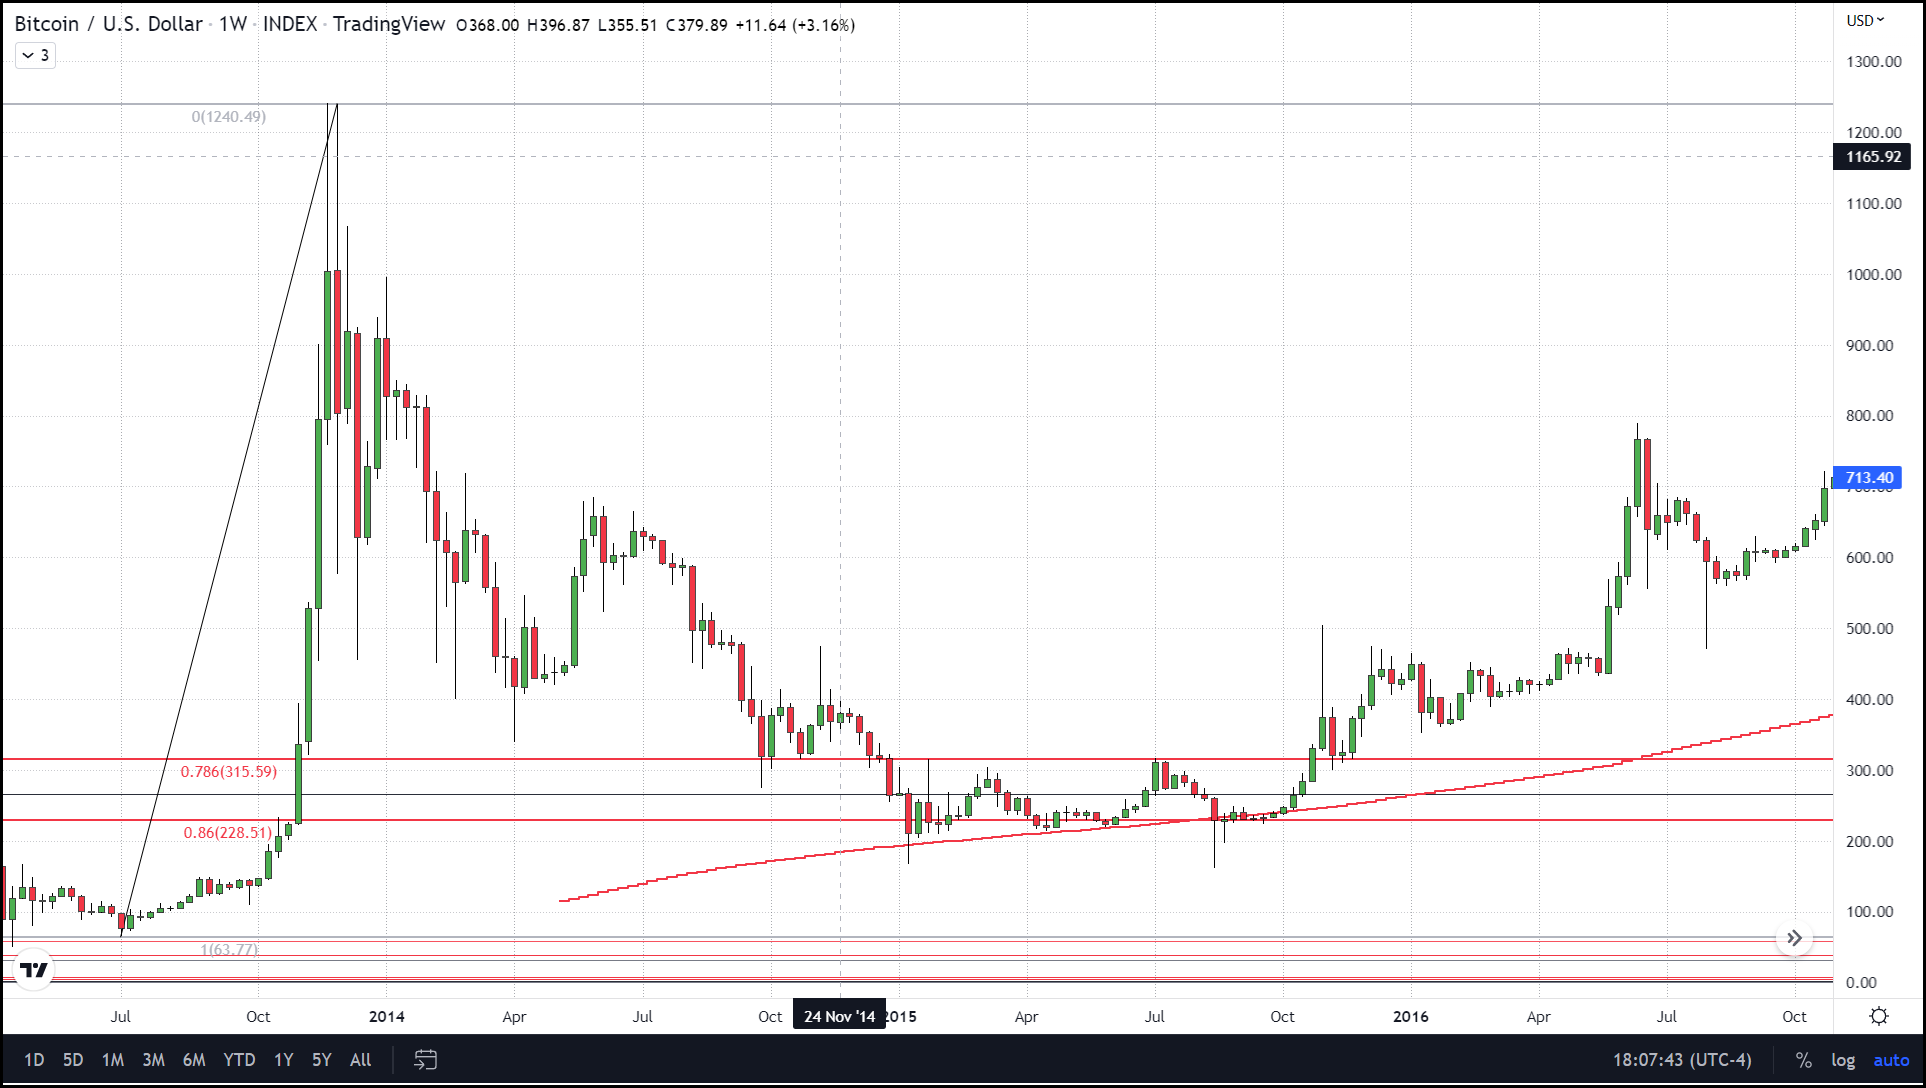
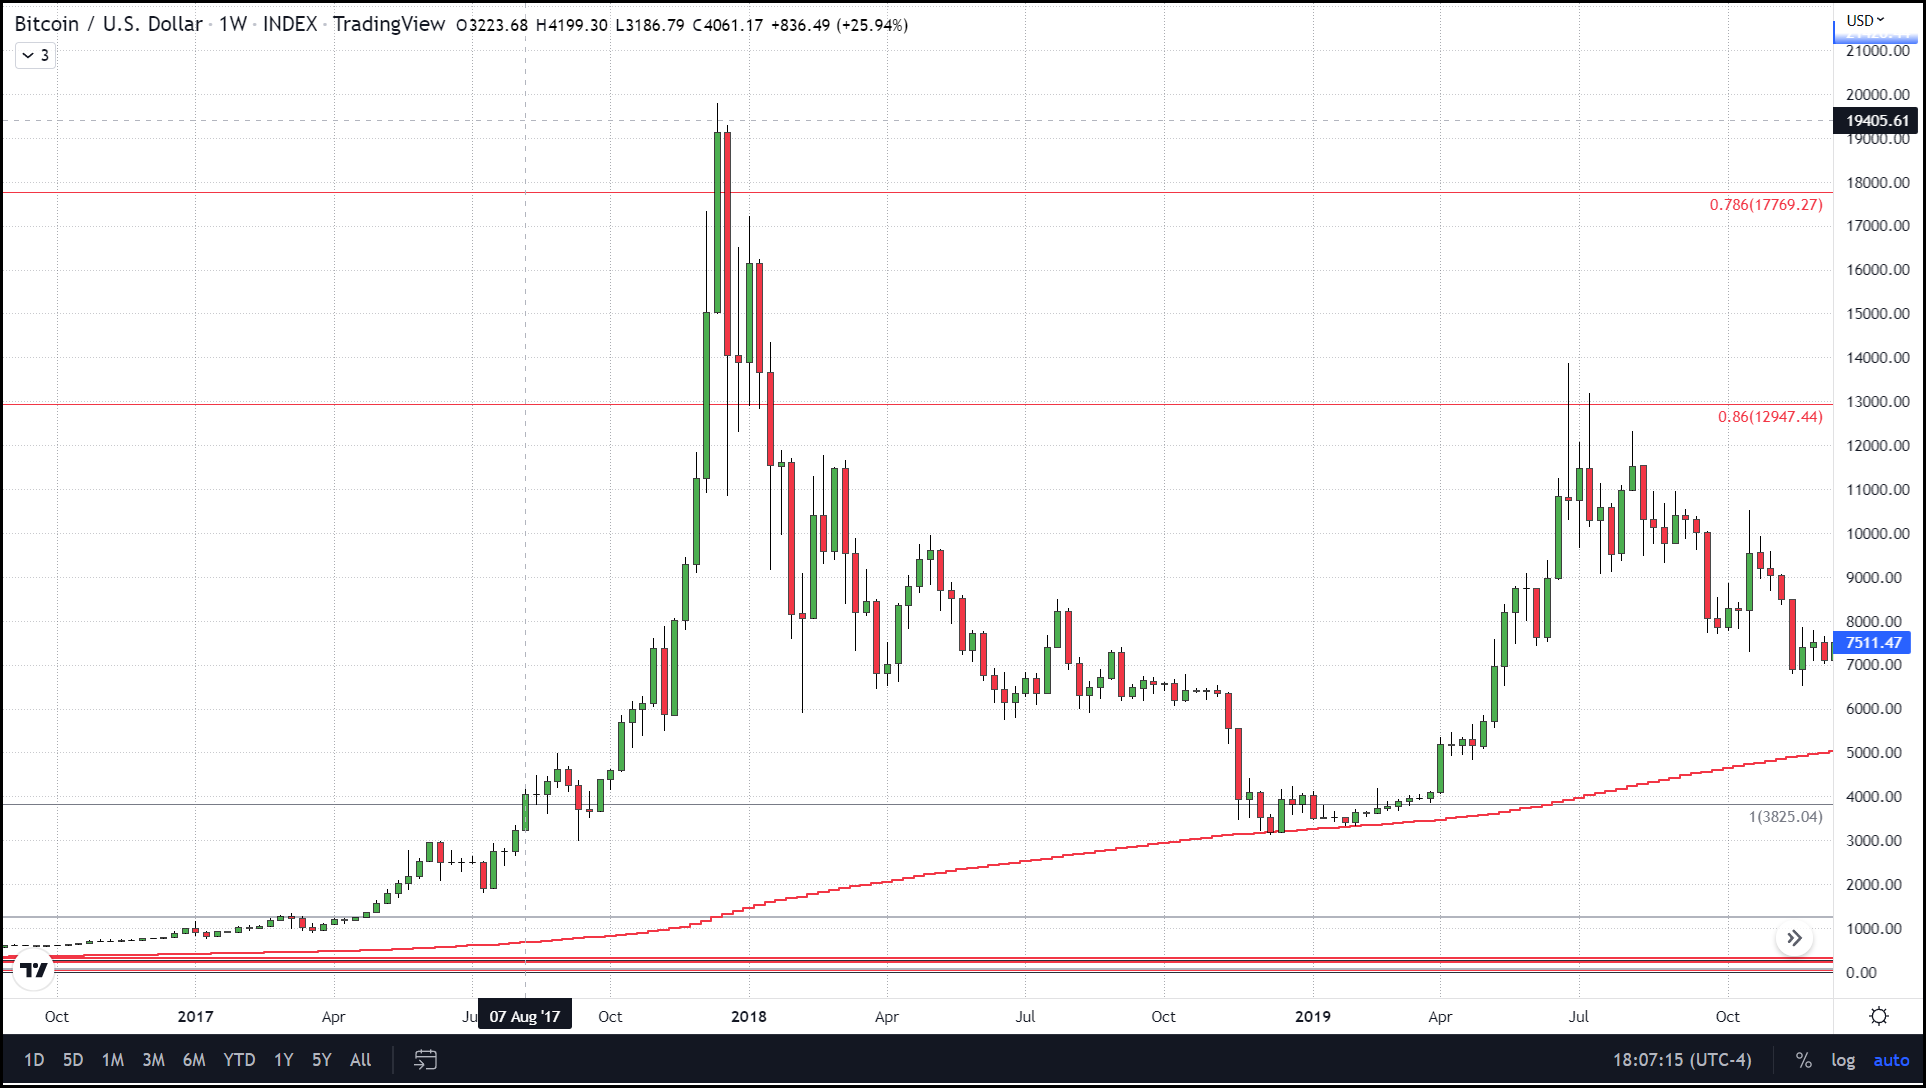
However, keep in mind that a 78% retracement was the minimum level it had to fall to, and the 86% level sits at approximately $13,000. On top of that Bitcoin is facing current resistance from a technical indicator that has acted as support and represented price bottoms on many of Bitcoin’s major corrections going back to 2015. I am referring to the 200-week simple moving average, this technical indicator has always represented major support during bitcoin's most bearish corrections, only being broken briefly during March 2020’s Covid-related crash. In that instance, BTC closed out the week roughly $100 below the 200-week SMA. That was the only instance of a weekly close below this average in Bitcoins history, that was until last week.
Last week, the week of June 13th when the 78% retracement level was hit was the first time we had a close that was significantly below the 200-week SMA when we closed out the week almost $2,000 below this indicator. This week is the first and only time where a weekly candle opened and closed below the 200-week SMA which currently sits at $22,500. This could prove to be a tough nut to crack in terms of a resistance level seeing as it served as such a strong support level in so many instances and now appears to have flipped to resistance.