Twin Tops in Bitcoin

The path that BTC has taken over the past 2 ½ months should really be no surprise to us at all, for it has followed the exact same trajectory in the three months following its first ATH ($65k) in 2021. Not only have the corrections following both all-time highs matched in both intensity and duration, but the rallies proceeding the apex in both instances also share very similar characteristics. If it continues to follow the symmetry that it has exhibited since December 2020 then we should be in for approximately one more month of further consolidation before rallying once more to a new all-time high by late spring or early summer.
Both of Bitcoin’s historic moves to $65,000 and above were part of eight-month cycles in the digital asset. The first full cycle I am referring to is the eight months from October 20 - July 20, 2021 in those eight months bitcoin completed a cycle of parabolic rally and steep decline before settling to form a base at $30,000. Before entering yet another eight-month cycle that could if it continued symmetrical path should conclude by the end of February. One is all very Thursday
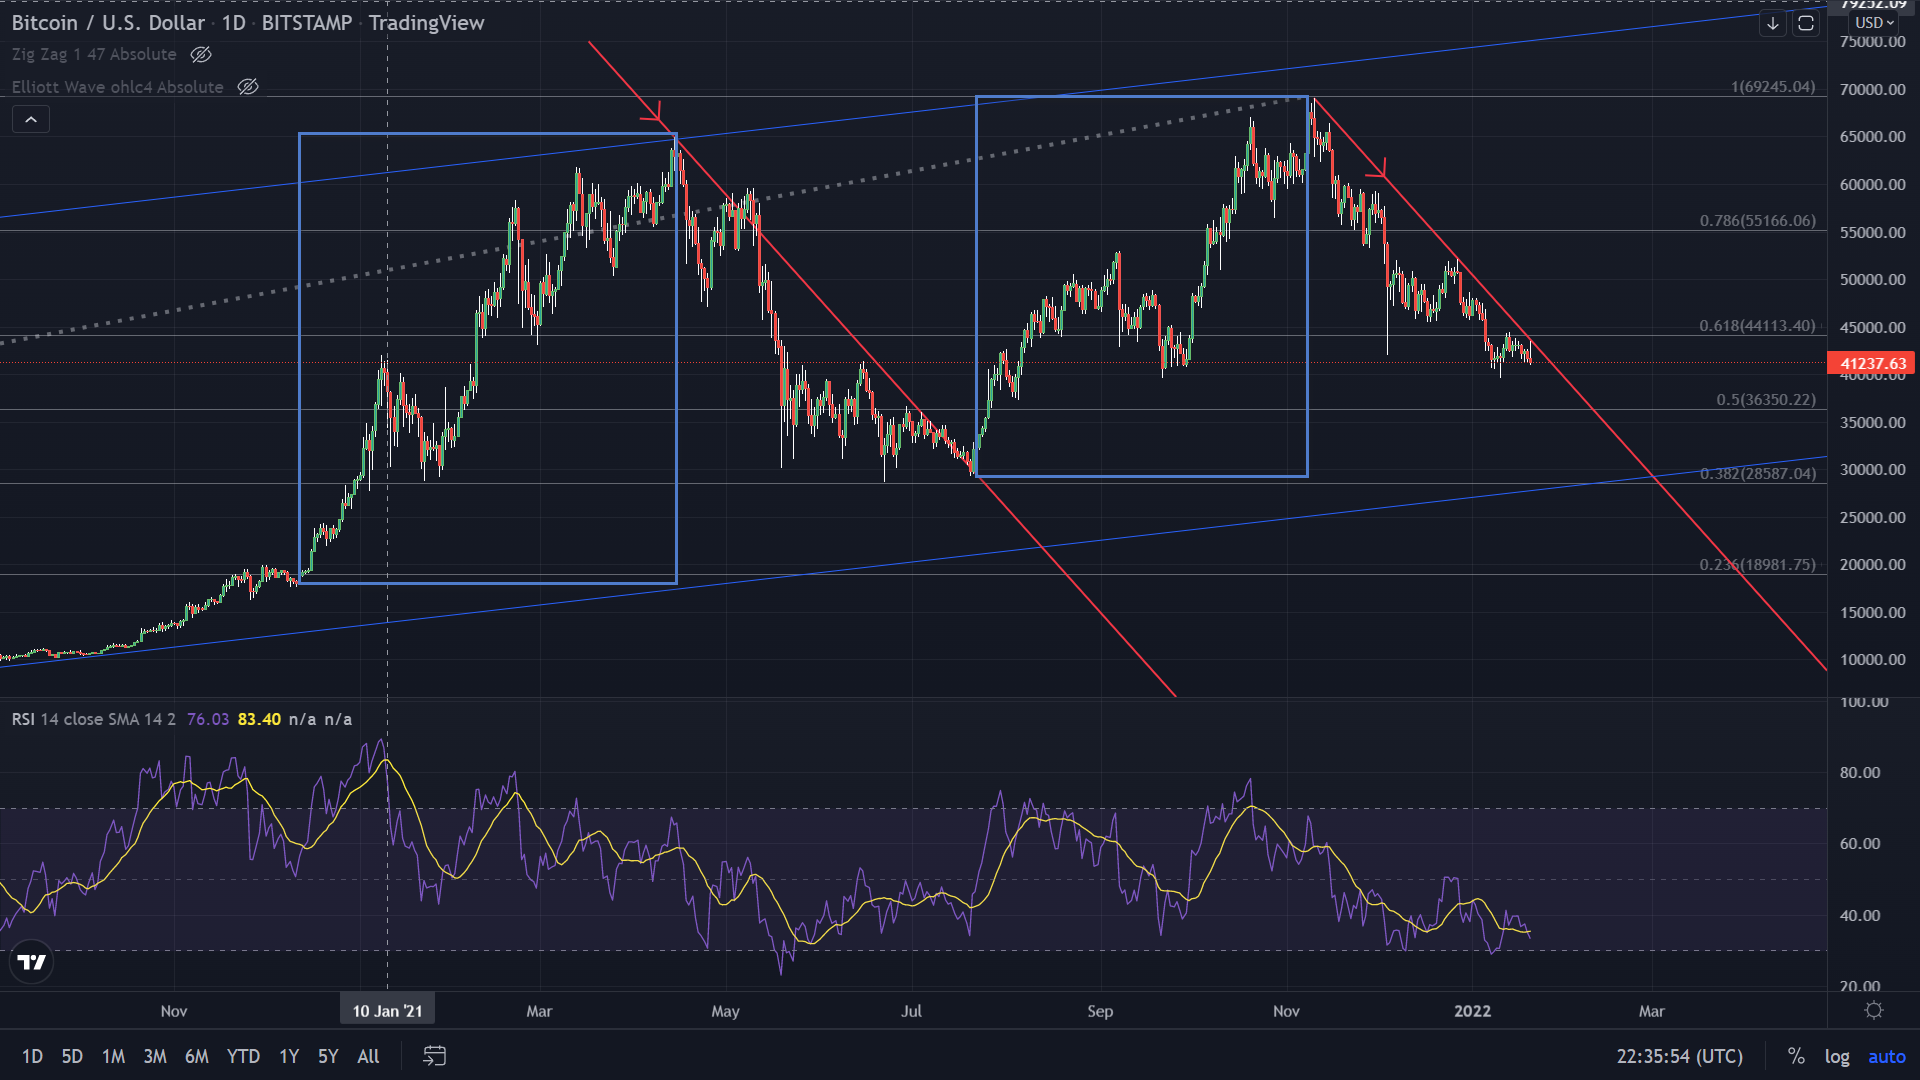
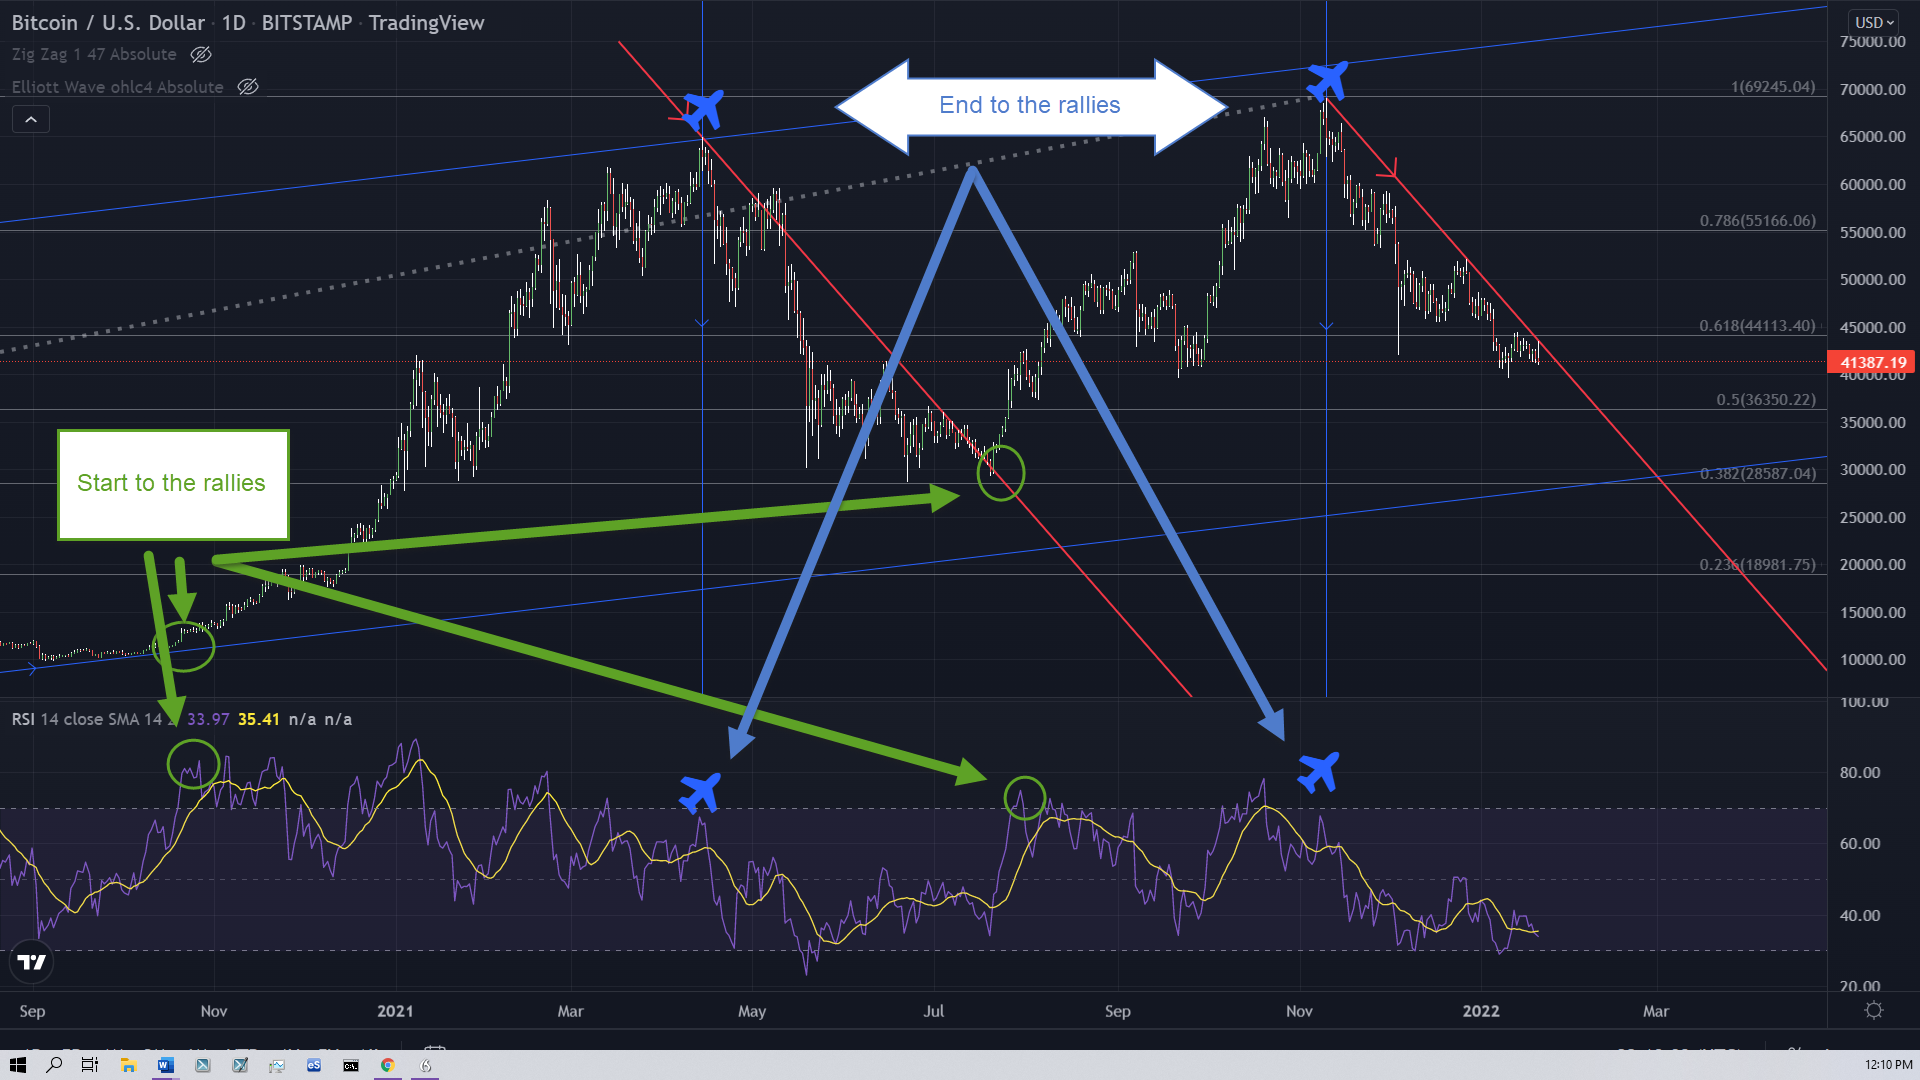
The 14-day relative strength index on both occasions has tipped off the start of these 8-to-9-month cycles in Bitcoin. They also signaled the bottom in both instances, on May 19, 2021 the 14-day RSI dropped below 30 hitting a bottom at 23.30, on this day bitcoin also hit bottom in price at roughly $30,000 a bottom that it would go on to retest on two more occasions rallying after the latter. On January 7, 2022 the RSI dipped into oversold territory once again and pricing hit a low of roughly $40,000. On the last bottom the RSI dipped a second time into oversold territory in mid-May it seems as though we may dip into oversold territory in bitcoin once more during our current bottom as well before it finishes its consolatory period. We also may be tipped off by an RSI that enters overbought territory.
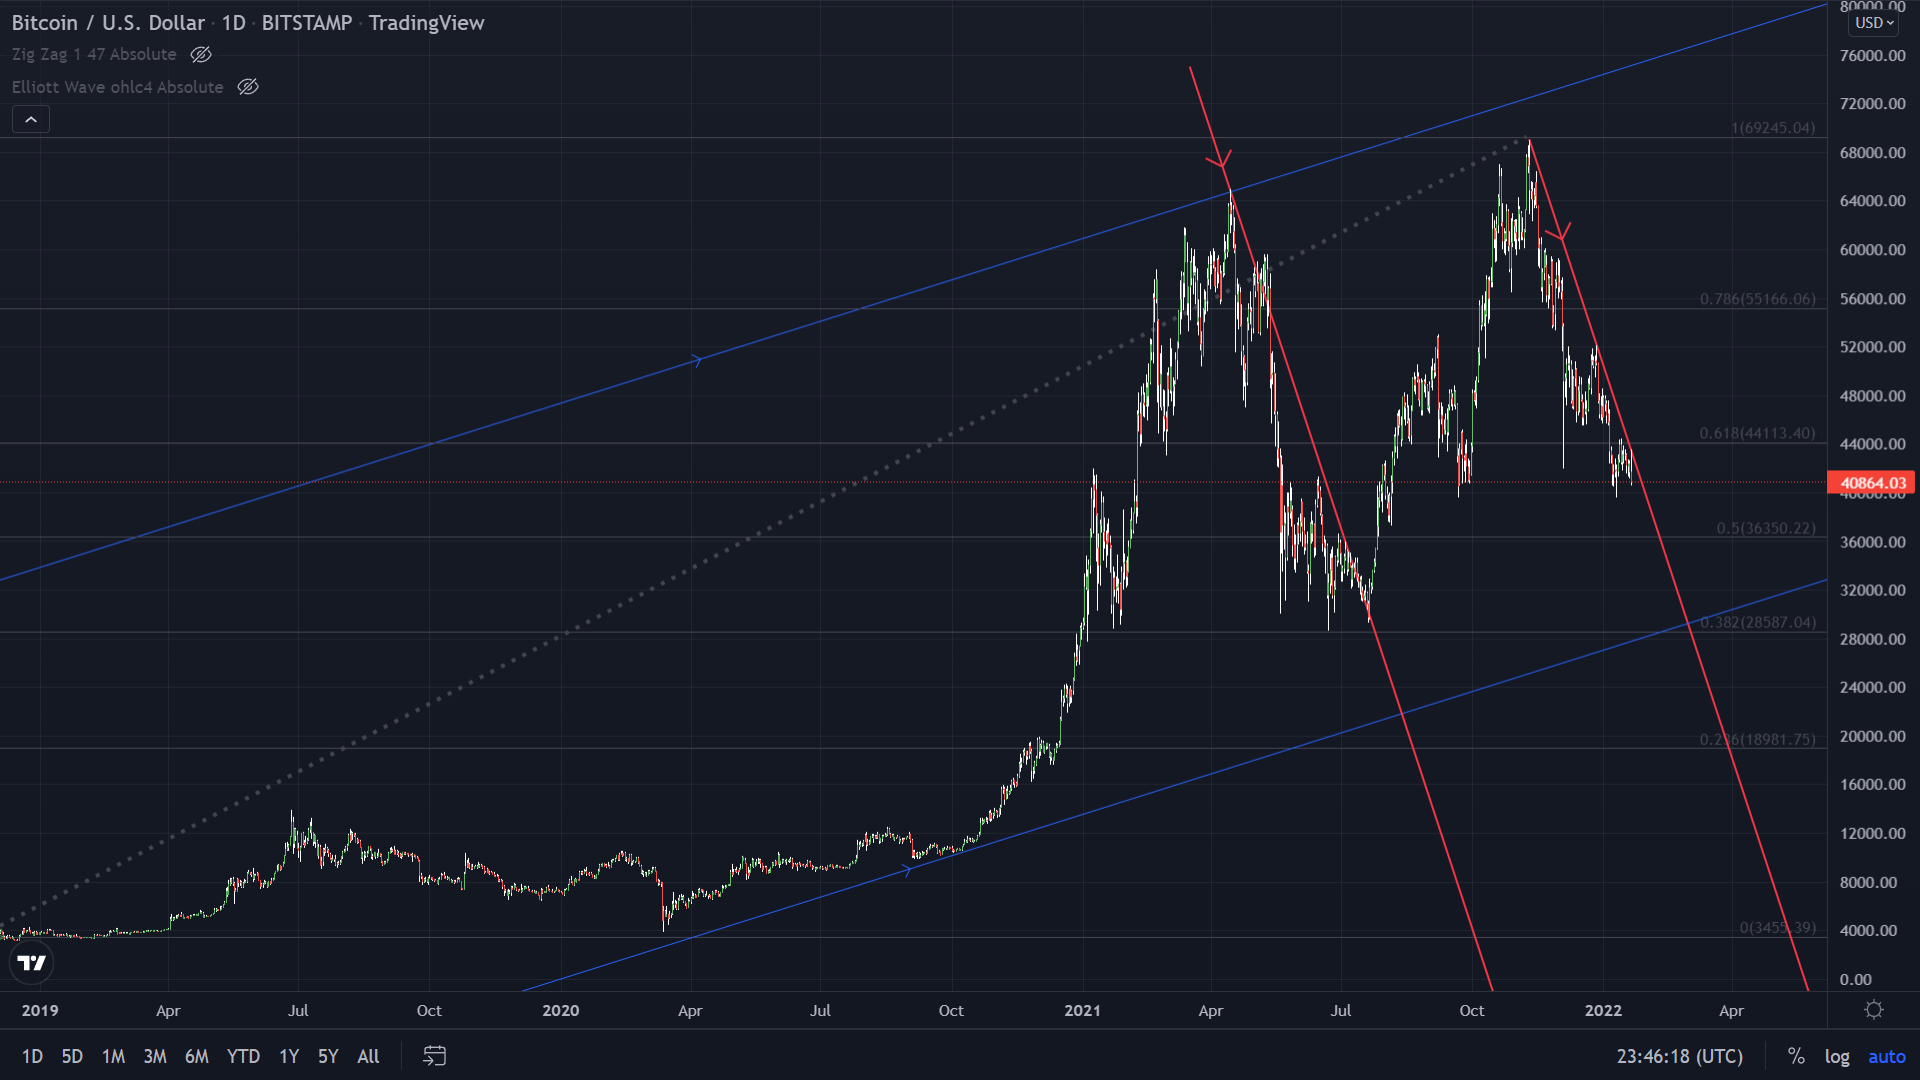
Another facet of these priced action in the longer-term is the ascending channel Bitcoin continues to trade in illustrated by the blue trend lines.
Should this pattern continue as it has and that would mean we would see another large rally beginning early Spring. All things being equal this symmetrical evolution of price in Bitcoin may be the path of least resistance and as they say, things usually come in threes.