Binary factors bring bullish sentiment back into Bitcoin

Bitcoin is set to close out the month of November, posting gains for the third month in a row. Currently, BTC has gained around 10% this month which paints the picture of a trending market in the hands of the bulls. Over the past three months if Bitcoin has moved higher, gaining $13,500 or around 54%. After such a dramatic increase, traditional trading knowledge would dictate that a correction is right around the corner. However, Bitcoin is so far from a basic b**** and two entirely different factors are calling for further increase before any correction begins.
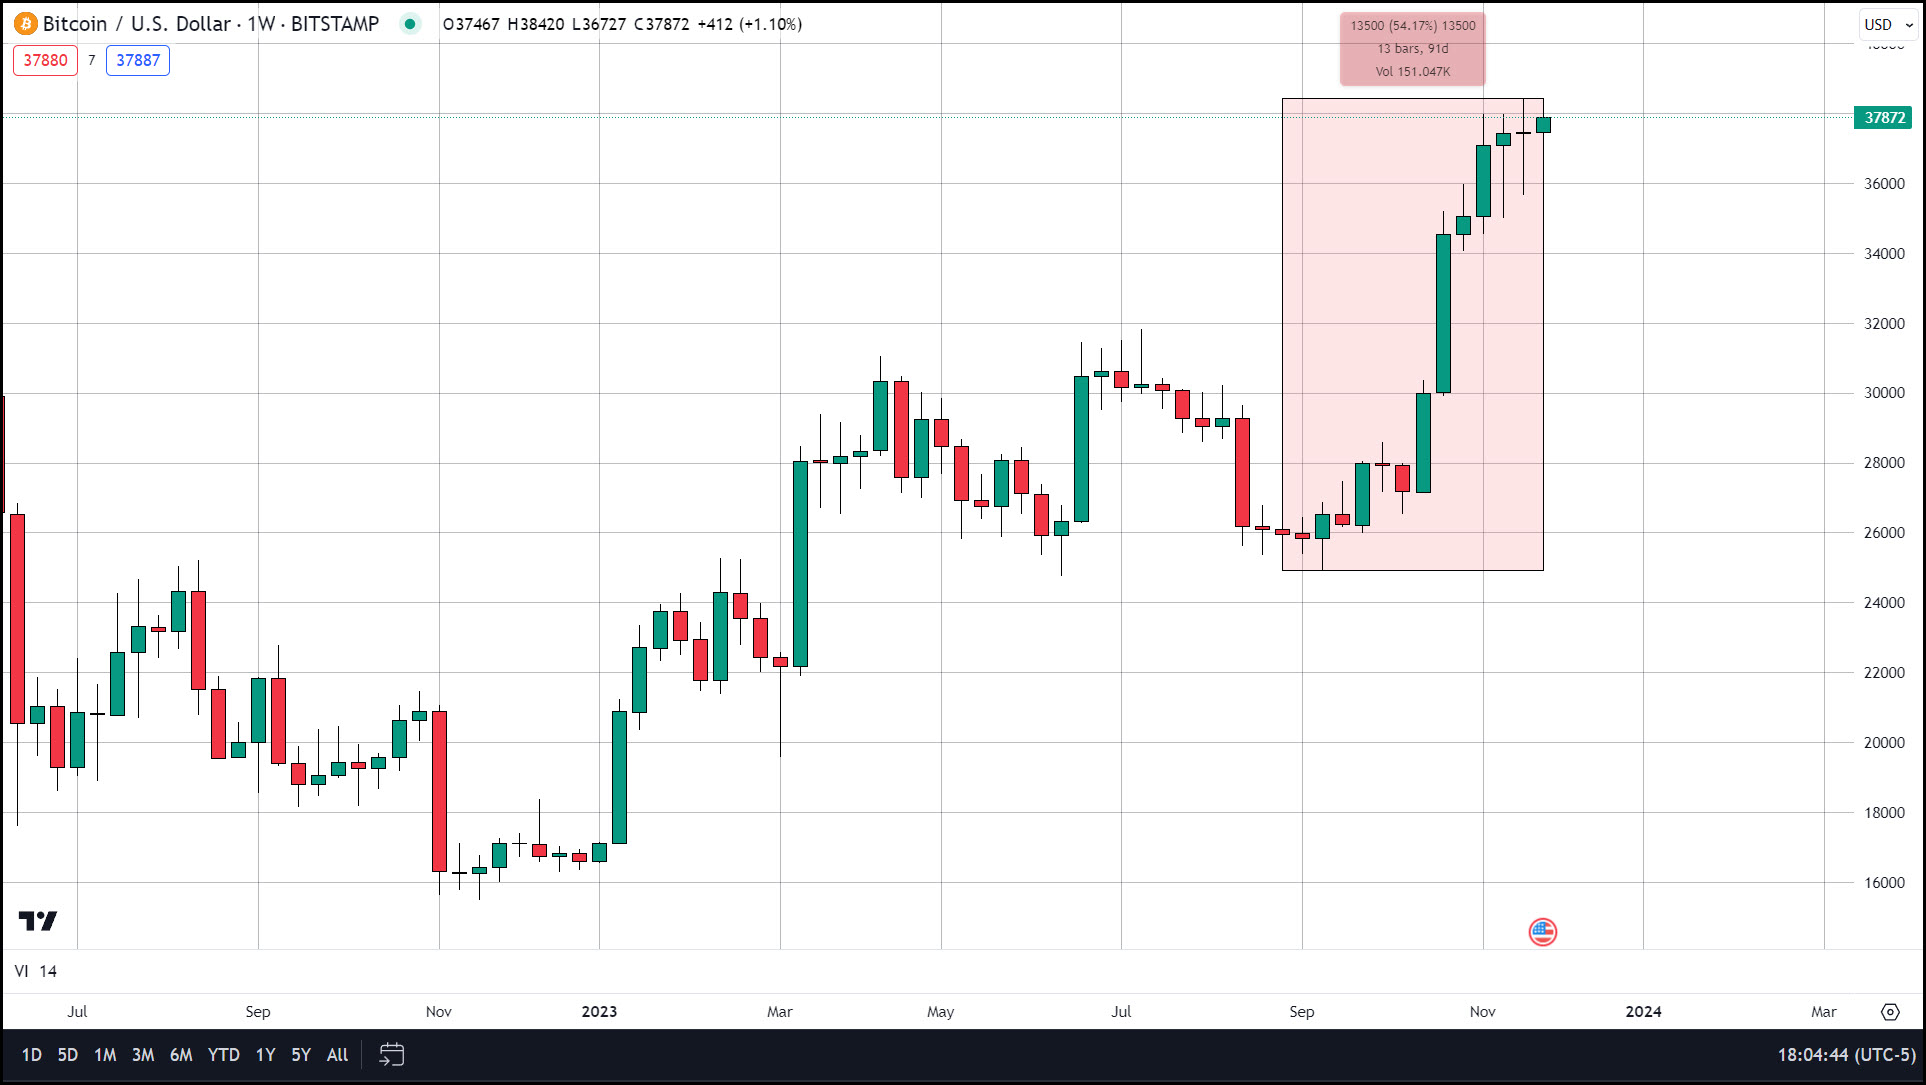
One of these bullish influences comes from a pattern that has been in play since 2015 present when October and November post gains on the month then December will be positive as well. My forecast has been predicting that Bitcoin will breach $40k before year’s end, (fall sharply in the first quarter of 2024 and rise to $58,000 at the next having event set for the second quarter of 2024.)

But BTC is unlikely to reach highs far beyond $40k, to anywhere near the level it traded at before the Fed began quantitative tightening back in March 2022 ($48,000) until the Federal Reserve begins normalizing interest rates (cuts rates). The timeline most analysts expect the Fed to follow puts the timing of the first rate cut around the forecasted schedule for Bitcoins next having event, sometime in the second or third quarter of 2024. The expectations for rate cuts have strengthened and the anticipated timeline for them has moved closer following comments by Fed Governor Christopher Waller today.
The voting member of the Federal Reserve who was nominated by President Trump during the pandemic is viewed as one of the Fed’s most hawkish officials. That is why the perceived dovish statement he made today rang so loudly. His words expressed that he was confident that the Fed funds rate was sufficiently restrictive enough to bring inflation down to the 2% target.
Solana’s symmetry suggests a re-test of $60 ahead
To me, symmetry in markets is akin to nuggets of gold buried in the noisy rubble of a constant stream of data hidden from view. Like an optical illusion, once you discover the actual image your brain had unknowingly altered to fit a mold of what it expected to see based on past patterns you cannot unsee it. The countless hours spent sifting through charts are made worthwhile upon uncovering these patterns that reflect my belief that everything in the universe is striving for balance. Sometimes these patterns are not as veiled and pop right out of the chart, such is the case with Solana’s 4-hour chart.
Yesterday I was able to unearth some shiny symmetrical Fibonacci based gems. First, I wanted to see if the low, reached at 11:00 AM EDT, was going to provide support or if a further decline was the most likely scenario for SOL. I attempted to find my answer by creating a trend-based Fibonacci extension starting from the opening price of last Monday, November 20th down to the lows reached the following day (Nov. 21st) and back to the highs reached last Saturday, November 25th. The Fib. Extension plotted the low of $53.47 (hit one hour before performing this study) pennies away from the 61.8% extension. At the time Solana was trading only a few cents higher within the range of the previous four-hour candle, but the synchronicity with the 61.8% extension convinced me that Solana had made its bottom and would re-test resistance at the top of its short-term range spanning from $51 - $61. Today SOL did indeed continue higher from the 61.8% extension ($53.58) and as of 5:00 PM EDT is trading at $58.12. Solana will surely trace back to the top of the $10 range and has a good probability of breaking out towards higher pricing.
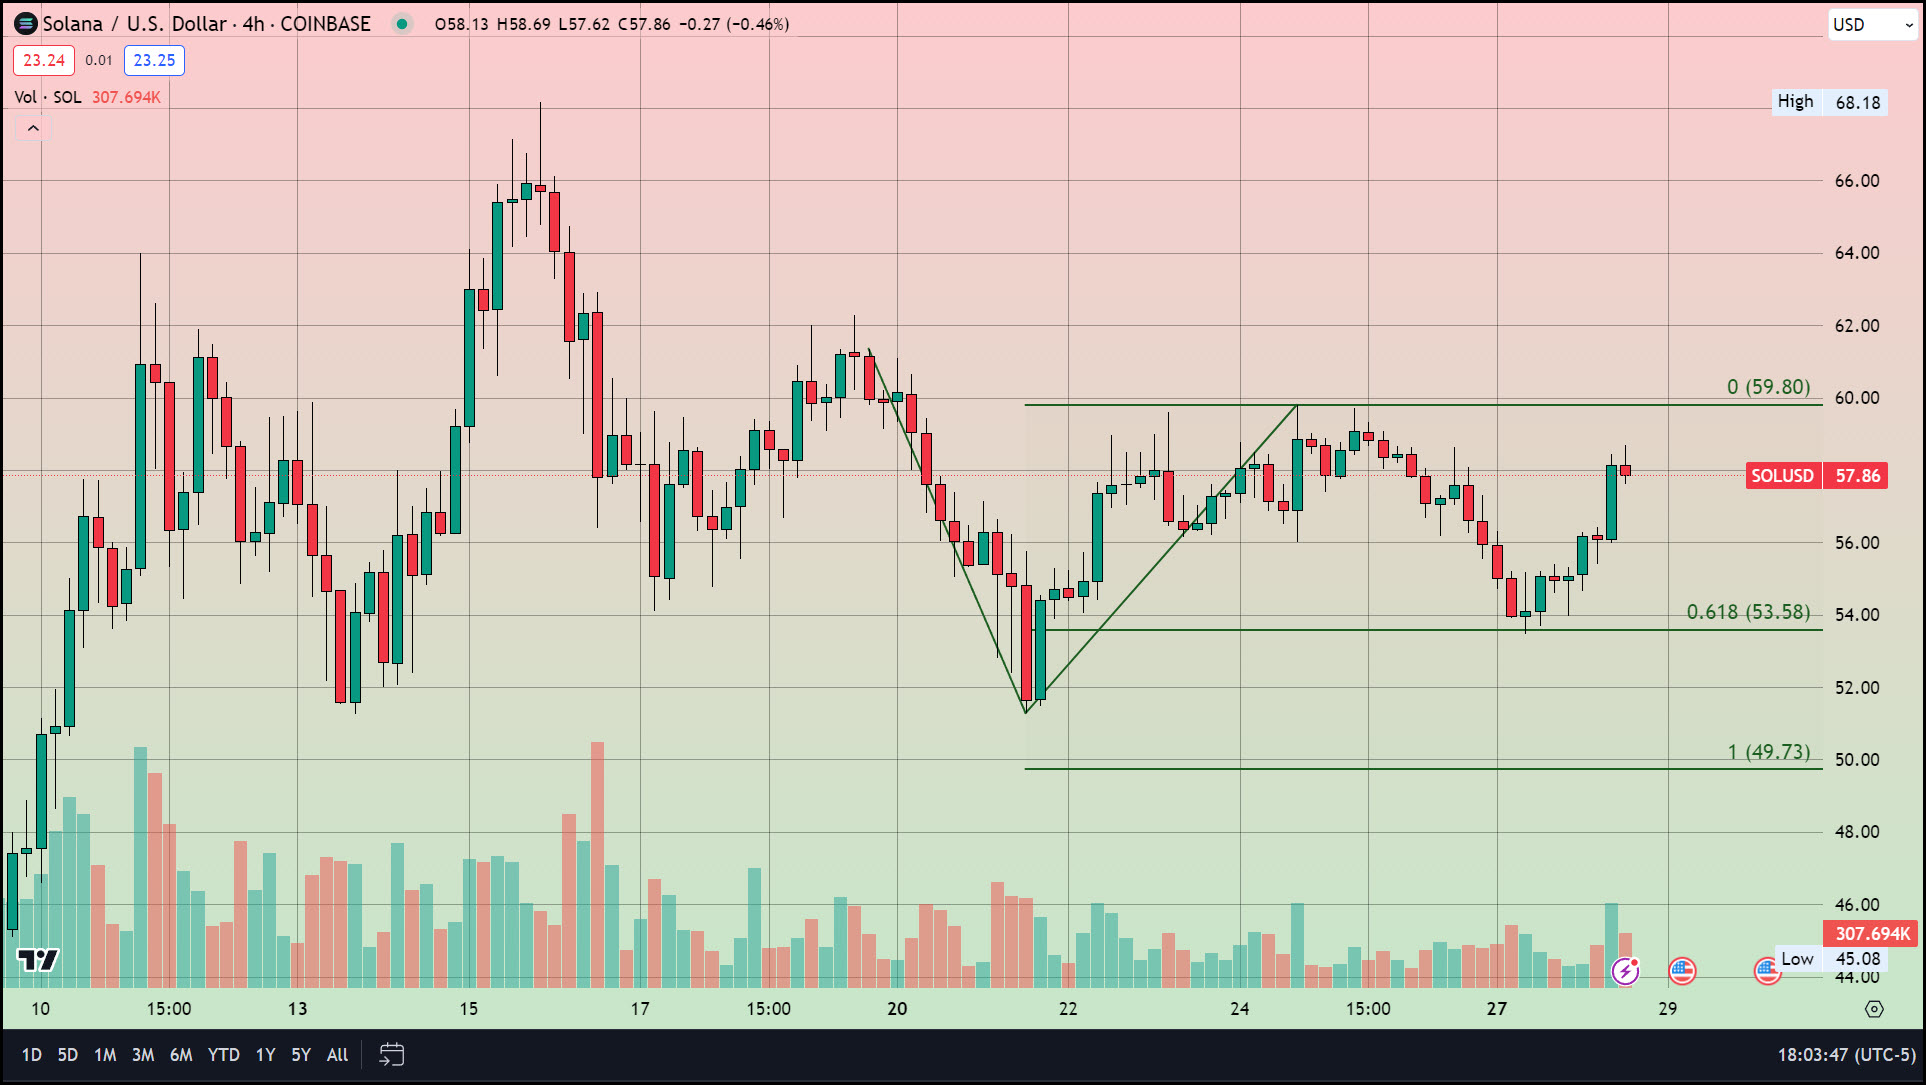
When I created Fibonacci extensions from the highs and lows preceding last week’s the 1.618% Fib. Level comes in precisely at this year’s high, just above $68. Taking it a step further, I created a parallel data set starting from the highs instead of the lows of the same price swing and reversed the Fib. Extension the 1.618% level matches up exactly to previous support ($38.06) that was hit six times on a 4-hour chart right before the massive rally that more than doubled the price of Solana. Symmetry is beauty quantified mathematically, and there are few things more whimsical than the symmetrical pattern that sits beneath the surface of Solana’s recent price action.

For anyone interested in Bitcoin and the most promising Alt. coins simply click this link and sign up for our service dedicated to trading these assets of the future.