Bitcoin closes at highest price in over a year

Bitcoin (BTC) made respectable gains today against the US dollar, trading up 1.63% as of 6:45 PM Eastern Standard Time (7/3/2023), or just about $500 on the day. While this increase is a rather modest one for BTC the high of the day is a price that has not been seen in over one year (June 7, 2022). On top of that, it managed to close near the highs currently at $31,122. This marks the first time that Bitcoin has managed to crack and hold above $31,000 since 2022.

As far as technical indicators the MACD alludes to sideways action being the most likely path, all the major moving averages are confirming that BTC is still solidly in a bullish mode and one of the most useful short-term moving averages the 20-day exponential moving average also is telling us the rally BTC is still intact.

Looking at a weekly candlestick chart of Bitcoin with the 200-week moving average as well as an Ichimoku cloud. Ichimoku translates into “one look” and is one of the most powerful technical indicators in our arsenal. The chart below has a modified version with the conversion line, baseline, and lagging span all removed leaving just the cloud formation itself made from the space created between the leading span A and B. The very simplified way to use this indicator is to buy the market when the candles are above the clouds and sell the market when they are below the clouds. When a market is inside of a cloud that is an indication of a possible pivot or turning point from bullish to bearish or bearish to bullish. And lastly, the color of the cloud is predicting the future direction of price where green is calling for higher prices and red is calling for lower, you will notice how the cloud extends far past the current date in a chart making it one of the very few leading technical indicators.
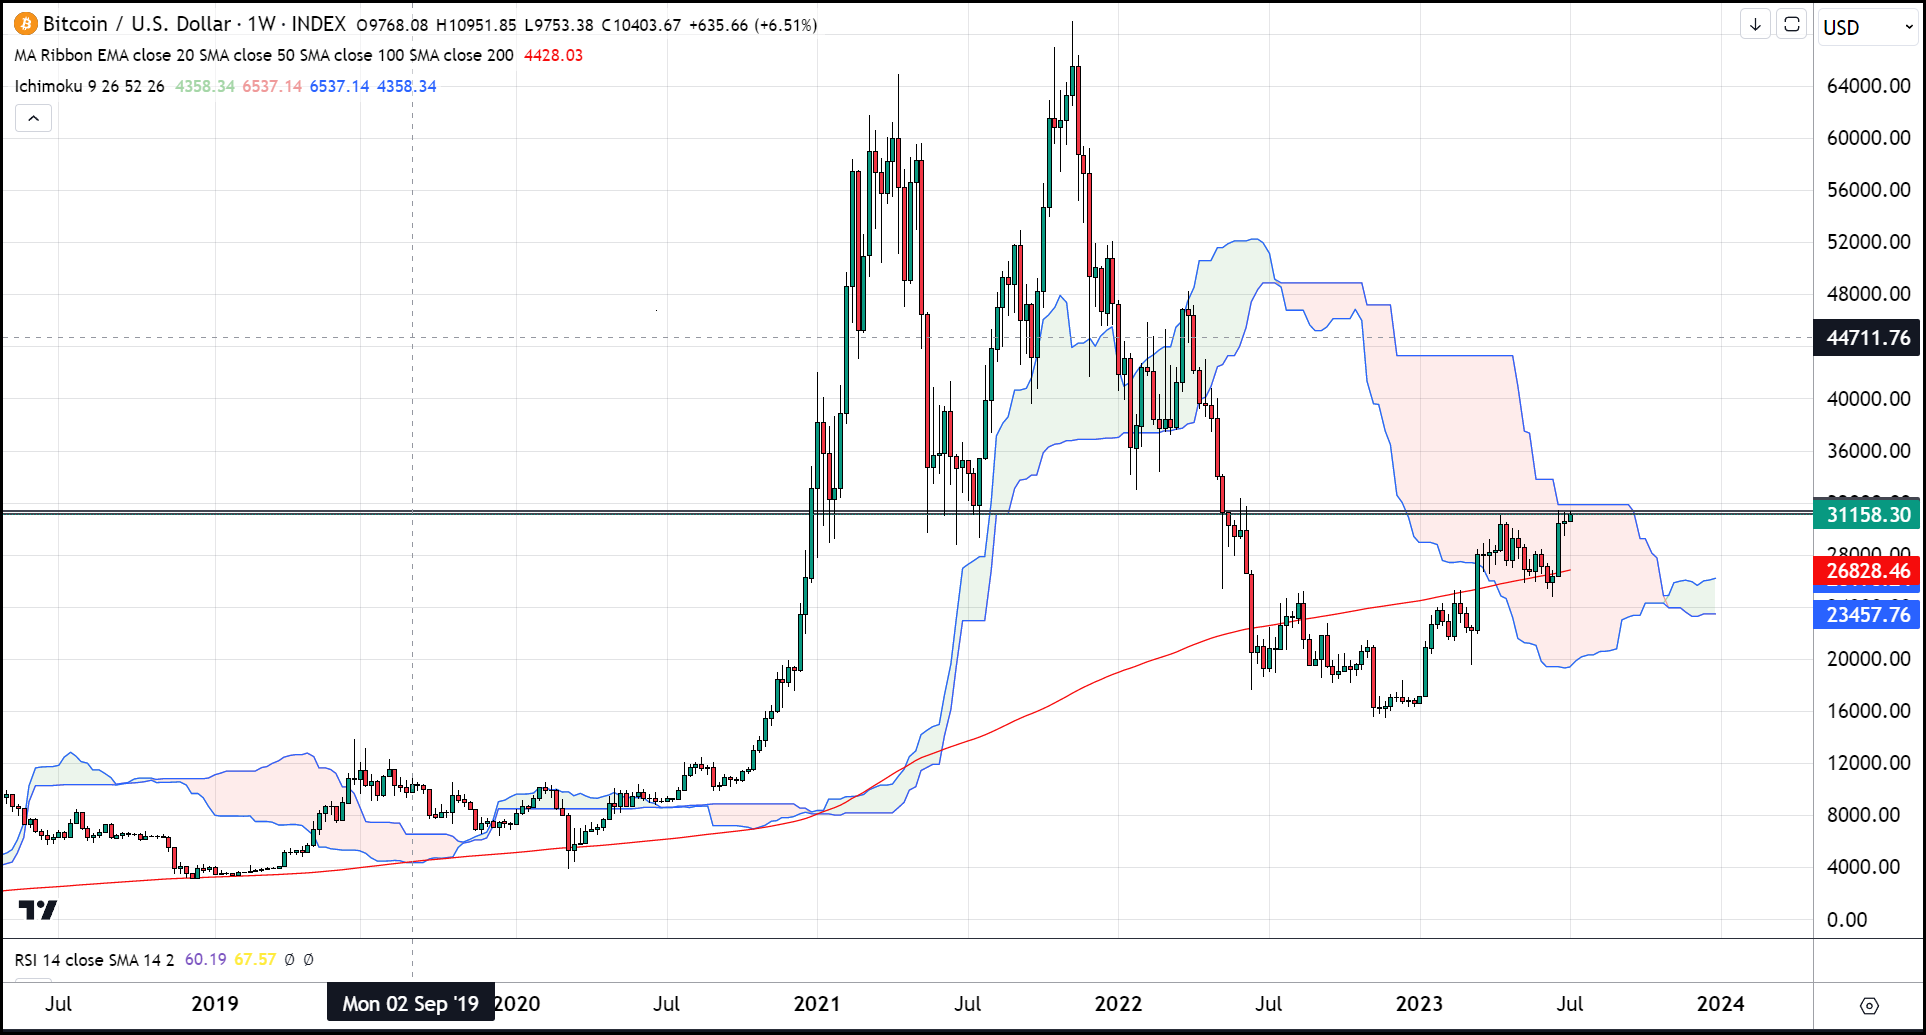
As shown above, BTC has been inside of a cloud since the end of March. Over the last two months it has made its way higher and higher and now sits within $1000 of breaking out above the clouds. The recent change in color of the front running cloud formation from red to green is alluding that this breakout is likely.
Use of Ichimoku in BTC historically
On our weekly chart dating back to the beginning of 2020, you can see how trading BTC using the rules discussed previously you would have been buying BTC back in July 2020 when it was under $10,000. You then would have exited the trade either in September 2021 or January 2022 at around $45,000. That trade would have netted you a 350% profit with no leverage in just under two years.
Following these basic rules once again we would have entered a short position in BTC in April 2022 at around $39,000. We would have exited our short positions in March 2023 at approximately $27,000 just as we pierced into the cloud we are currently inside. That short trade simply based on the most basic use of Ichimoku clouds would have netted you a 30% return on investment or $12,000 per Bitcoin.