Bitcoin’s bullish reversal sign signals buying opportunity
The most recent rally in Bitcoin last week brought BTC back above $20,000 and erased much of the “price” damage done by the FTX collapse, though many have called last week’s move market manipulation, I think that’s just an easy way of saying you don’t know why a market is moving.
In the past it was claimed that nearly half of all reported trading volume was made up, in an article published in Forbes magazine last August Javier Pax said, “More than half of all reported trading volume is likely to be fake or non-economic,” said Pax. “The global daily Bitcoin volume for the industry was $128 billion on June 14. That is 51% less than the $262 billion one would get by taking the sum of self-reported volume from multiple sources.” However, these claims were citing a 2019 report that compared unregulated exchanges to regulated ones.
The fact is that Bitcoin just had a very strong bullish reversal pattern last week and trader’s who were short and people that are opposed to Bitcoin, in general, are spewing more FUD to keep us from noticing BTC looks to have finally found a bottom.
The candlestick pattern that occurred last week is known as “three white soldiers” this pattern doesn’t occur that often but when it does it is one of the more reliable reversal patterns. Investopedia describes it as,
“Three white soldiers is a bullish candlestick pattern that is used to predict the reversal of the current downtrend in a pricing chart. The pattern consists of three consecutive long-bodied candlesticks that open within the previous candle's real body and a close that exceeds the previous candle's high. These candlesticks should not have very long shadows and ideally open within the real body of the preceding candle in the pattern.”
Other indicators used to confirm or deny the validity of this pattern all seem to point to it being valid. The first is volume, which if half is faked then the rise in activity would still be shown just at more elevated numbers. During the three long green candles that fit the description above Trading volume was highly elevated nearly double the volume seen in previous weeks.
The other technical indicator used in conjunction is the RSI hitting a peak above 70. To quote Investopedia again,
“When trading the three white soldiers pattern, it's important to note that the strong moves higher could create temporary overbought conditions. The relative strength index (RSI), for example, may have moved above 70.0 levels. In some cases, there is a short period of consolidation following the three soldiers pattern, but the short- and intermediate-term bias remains bullish”
The description above details the current market perfectly, and with so much bad blood drained from the crypto ecosystem it makes sense that we would begin to see a rise, ideally, a run-up that is more gradual and sustainable than previous rallies.
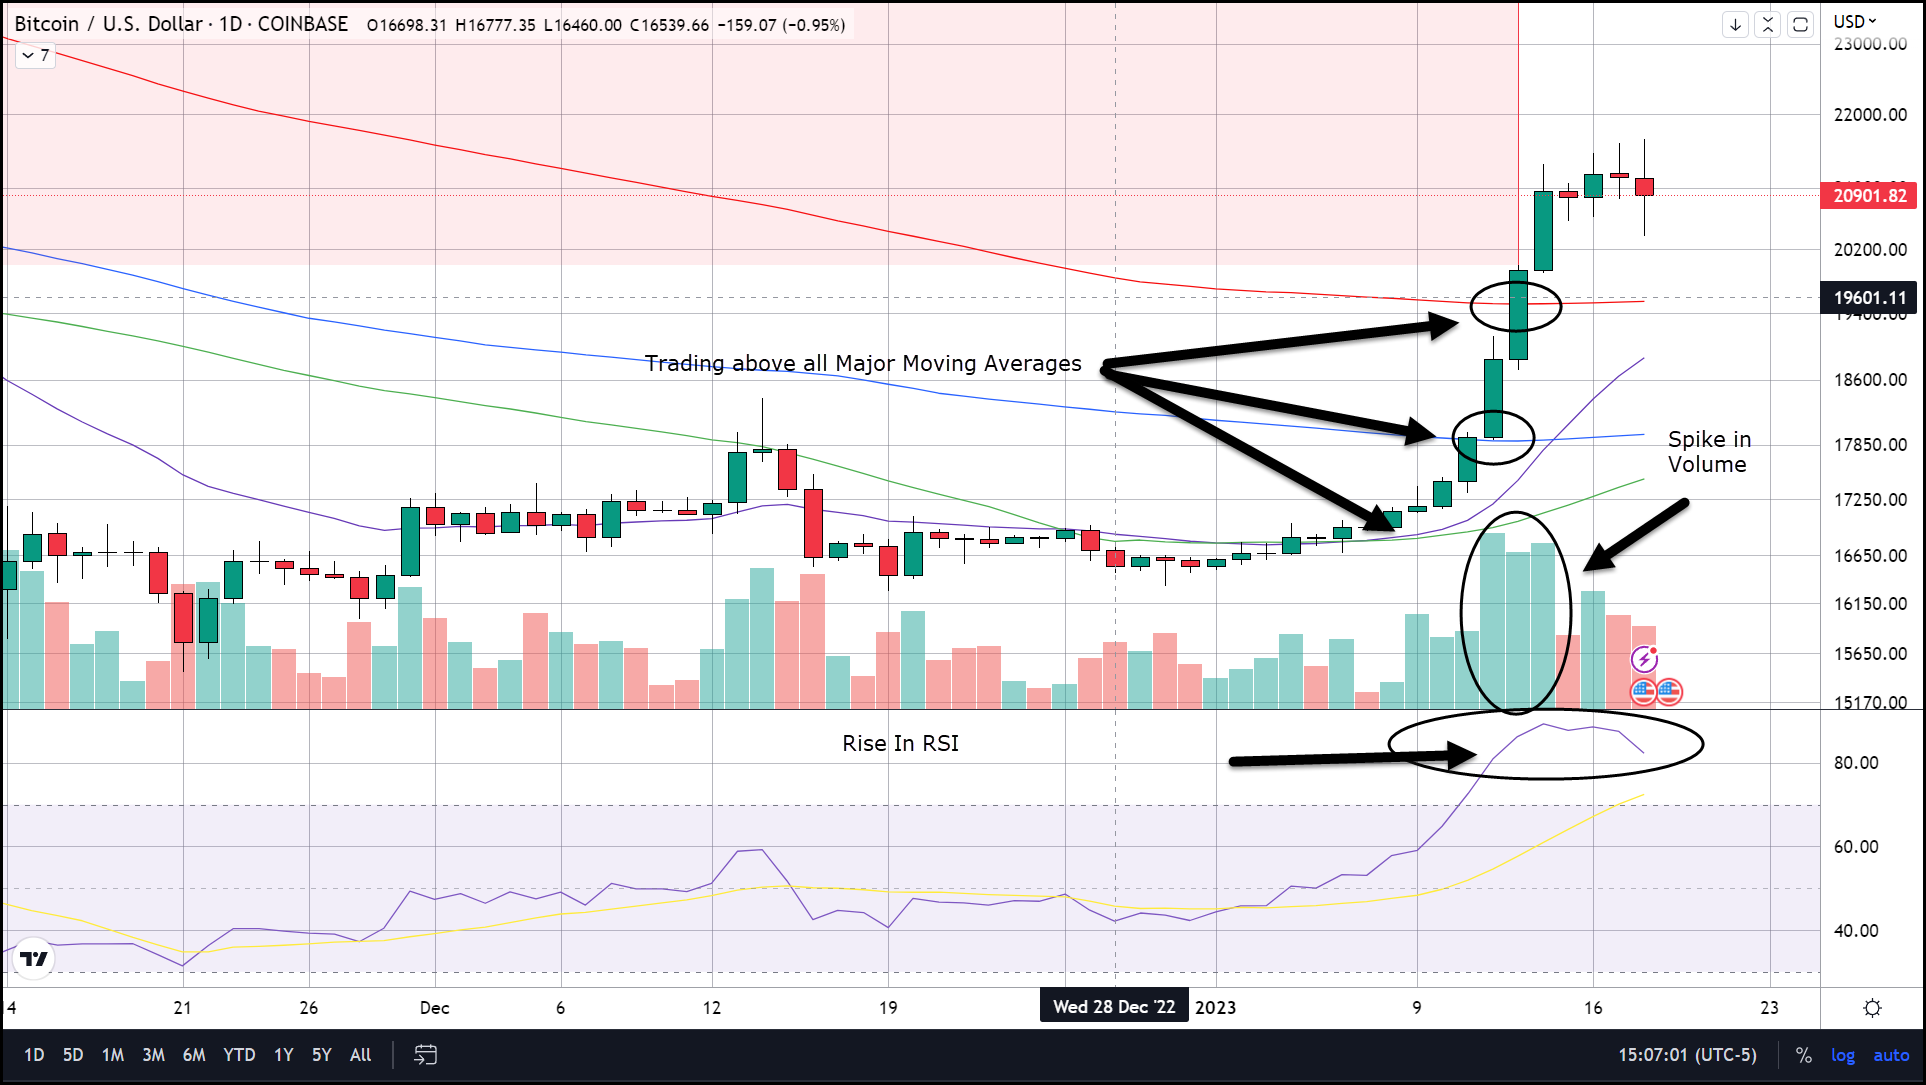
One more important indicator used to authenticate this pattern is moving averages. It is thought that as long as the price remains above the major moving averages price will continue higher. It just so happened we broke above the 100-day SMA on the first daily candle of this pattern and the final major moving average the 200-day SMA on the final “soldier”.
This gives us a great area to put our stop on the trade I am about to recommend. Since the pattern is followed by a consolidation period before moving higher again we have a chance right now to buy it before it moves higher and if this pattern proves to be correct it won't go much lower so we don’t want to wait for a pullback.
Trader’s who want to trade this rare candlestick pattern can Enter Bitcoin from the long side buying BTC anywhere from $20,300 - $21,300 (currently 3:30 PM EST $20,700 via Coinbase). Place protective stops right beneath the 200-day moving average at $19,400.
