Why current levels in BTC are so important

Bitcoin’s current price range has been keeping the volatility low for the last seven weeks of trading as pricing has been locked with a floor of $26,500 and a ceiling just above $30,000. On the surface, it appears as a normal consolidation after rallying over $10,000 since the start of the year, but when we look back historically the magnitude of Bitcoin at its current level is revealed.
When we draw out two long-term Fibonacci retracements that encompass Bitcoin's rise from March 2020 and another that covers its subsequent decline that persists for the entire 2022 calendar year, we get a harmonic confluence of Fibonacci levels right around current pricing. The synchronicity between the two data sets is made from the 38.2% retracement of our first data set and the 23.6% retracement of the second.

In the chart above is a weekly candlestick of Bitcoin/US dollar (Bitstamp). The first retracement and its levels are shown in green and the second data set is colored red. Both data sets are relevant as the retracement in red spans the last major highs and lows, while the green one spans beyond recent lows that have not yet been taken out. Between the two harmonics made we will be focusing on the lower one that occurs around $28,800 for several reasons we will explain in this article and of course, because it is very close to current pricing and has been for the past six weeks.
This level we are examining occurs between the long-term 38% and the short-term 23% and happens to be precisely where prices stalled after a $10,000 rally which began right at the beginning of 2023. That rally took the price of BTC off its local bottom and two-year low near $15,000. Up until reaching the level, I will refer to as 98.2˚ Fahrenheit as it is akin to BTC’s perceived health. Over this level and BTC’s temperature is heating up which if taken too far can lead to a buying fever before the heat becomes too much and the fever turns into a flu. Below this level and the average person perceives BTC as ill on its way to flatlining and losing all body heat as corpses tend to do.
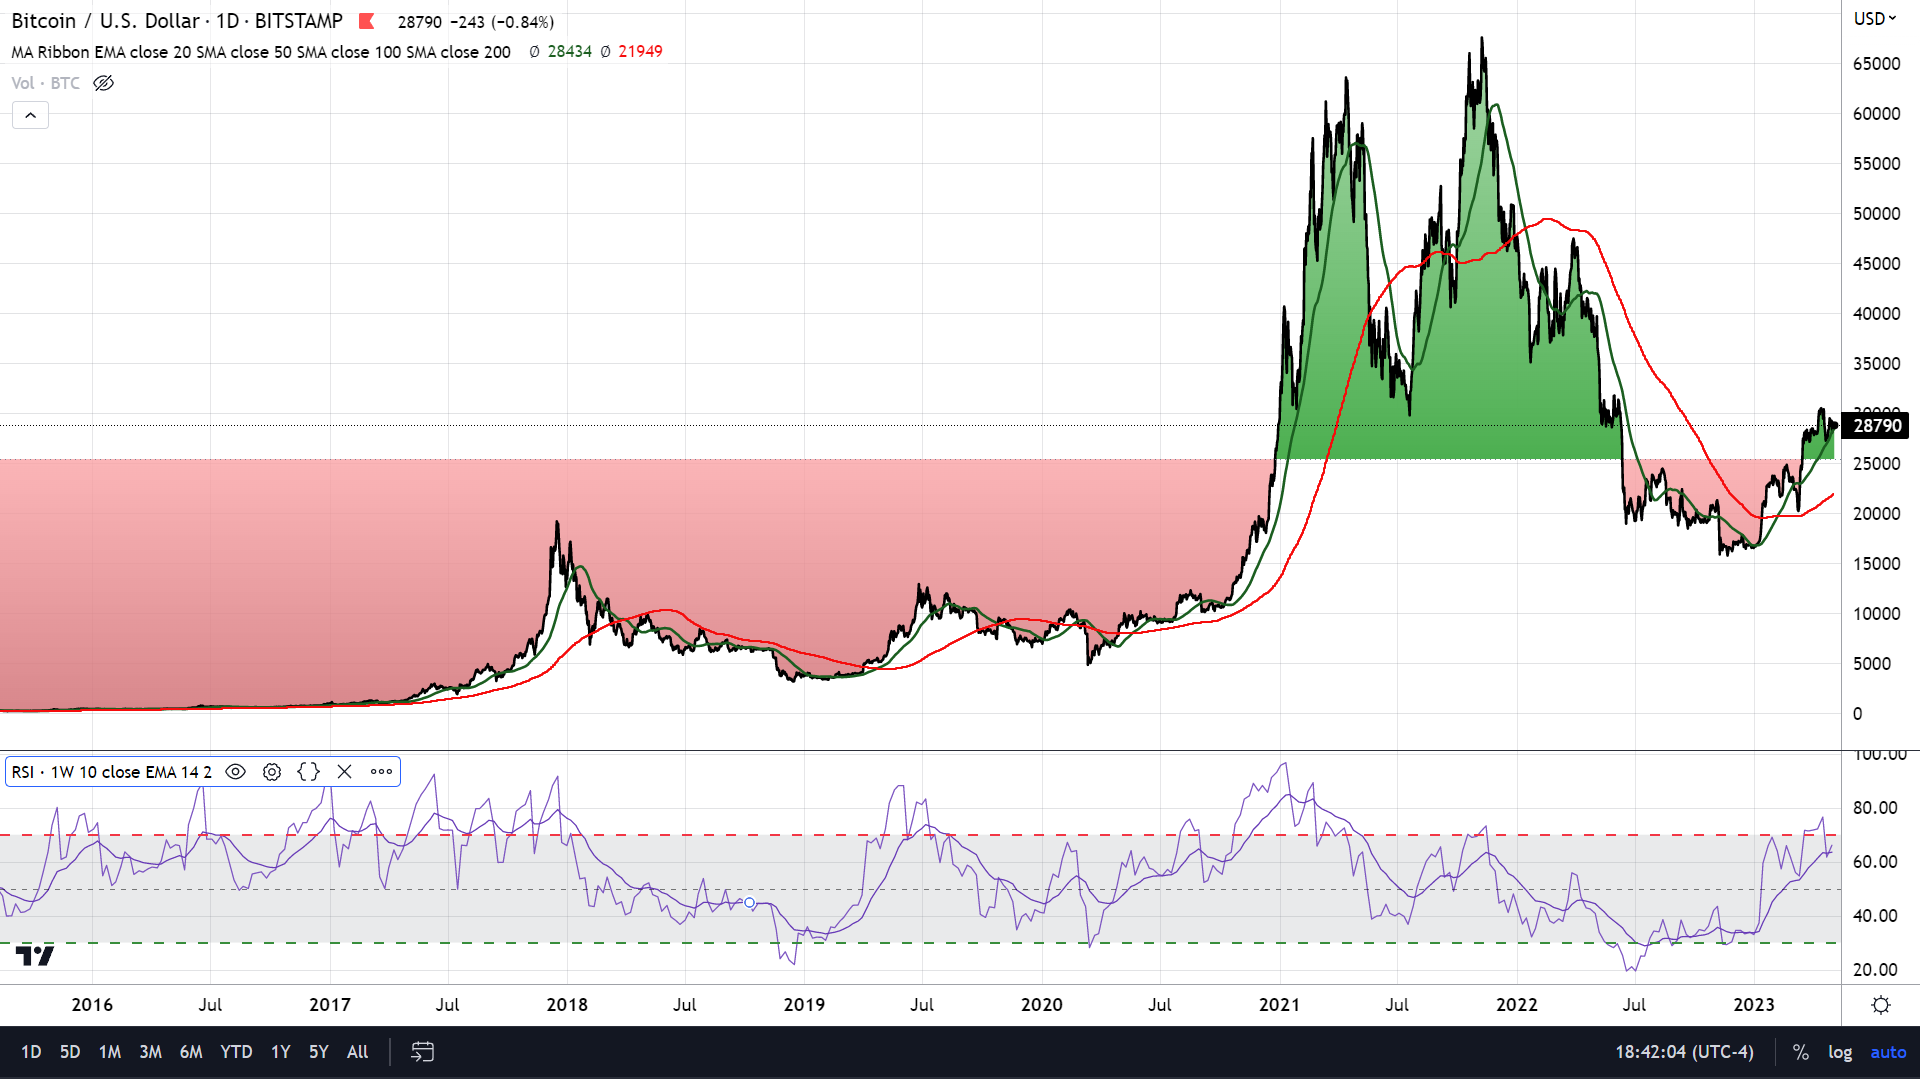
When we extend these levels back in time to the left on our weekly chart you will notice how 98.2˚ lines up precisely to Bitcoin’s triple bottom that formed support at three important instances over the past three years until prices broke below on June 6th of last year.
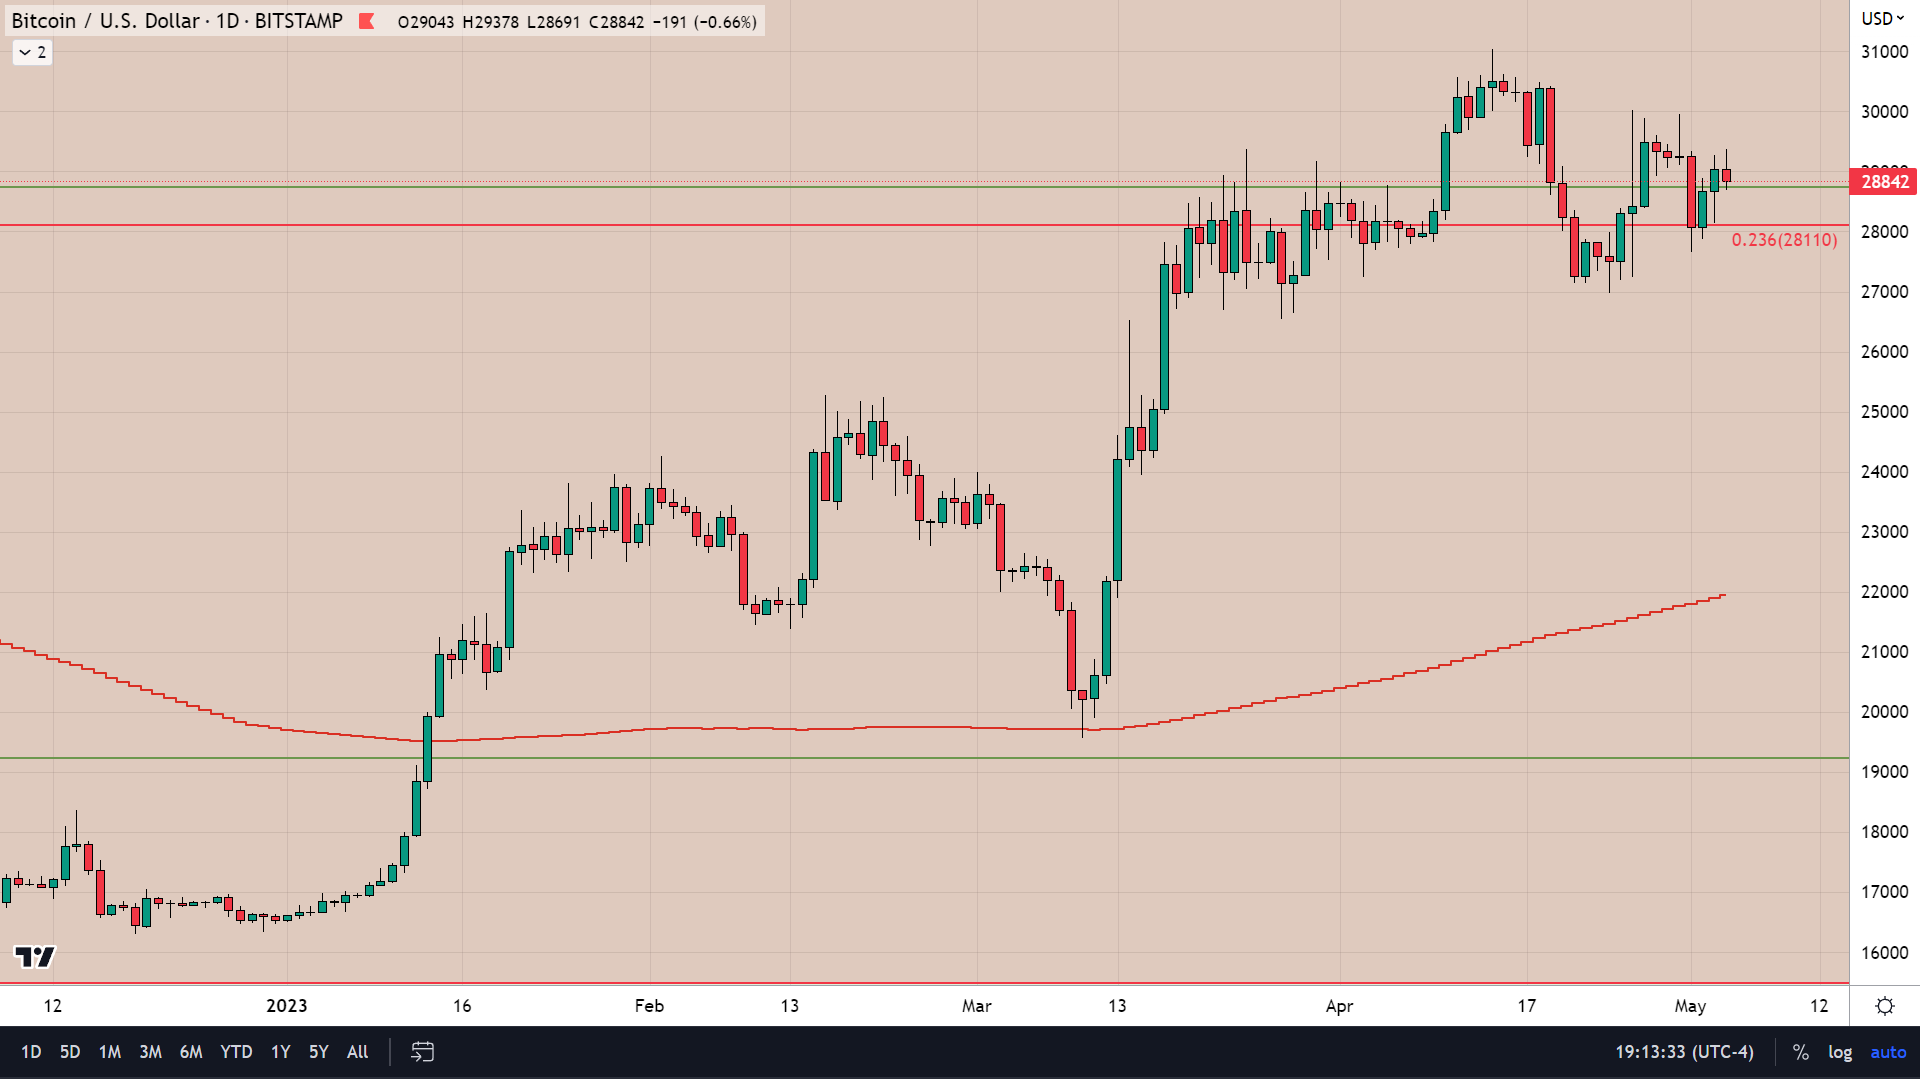
When we switch over to a daily candlestick chart and zoom in, we can see how after reaching this ban compromised of our Fibonacci harmonic after it was first reached on March 19 for six consecutive days BTC attempted to breach this area with upper wicks extending in and above it however the closing price did not make any headway. In the second and third weeks of April, we did see the bulls move the price above 98˚ but it was short-lived. Yesterday was able to close above 98˚ for the third time and today’s light decline of $173 or 0.6% at the time of writing (7:19 PM EST) can be viewed as bullish due to its low being at the top of this harmonic band.
Other than this level being key support/resistance for the world’s first and favorite digital asset I am positive of one thing, and that is when we do leave this area prices will move a vast distance and extremely fast, for better or for worse. I am betting on the bullish ‘better’ scenario.