Bitcoin has officially exited its recent trend

“Despite the initial ETF euphoria vanishing from market sentiment Bitcoin has held up rather well considering the $15,000 in gains that were largely fueled by its implications. That is why a correction should be expected
in the coming days.”
- excerpt written yesterday when I began this piece and trend was still intact.
Technically BTC could continue to rise as is true for every market, but my technical studies are painting a portrait of a market that is poised for a change of guard. Although I have been saying for months that the crypto winter has ended, but that also means that the bears are out of hibernation and ready to replenish themselves from their seasonal slumber.
Averages that allude to the bears being in control
As you may start to or even already ascertain this article was created and much of it written yesterday before the studies, I am about to discuss had confirmed what they had hinted towards on Wednesday. Regardless they remain relevant so I will continue to explain how I came to my hypothesis which was confirmed today.
The first and most widely known of these studies involves the moving averages. While studies suggest that the most effective trading strategy based on moving averages (according to an article written by Azeez Mustapha, published in November 2023 in “Technical Analysis of Stocks and Commodities”) involves the use of three simple moving averages consisting of 20, 40 and 80 cycles. Azeez explains that the time cycles are not important and can be used for day trading or long-term trades and that these 3 lengths of SMA have been proven to be most effective in trading especially in the “three moving average strategy” outlined in his article.
However, the ones I tend to focus on are the 50, 100, and 200-day simple moving averages alongside the 20-day exponential moving average. In short term trades I utilize the 20-day EMA as such, If going long the price must be and remain above this EMA and any close well below it would dictate exiting the trade, the opposite is applied to short trades. The simple moving averages I pay attention to come in to play when forecasting support/resistance and since these “major moving averages” are also the most watched by traders large and small affect overall market sentiment more so than any other indicator I am aware of.
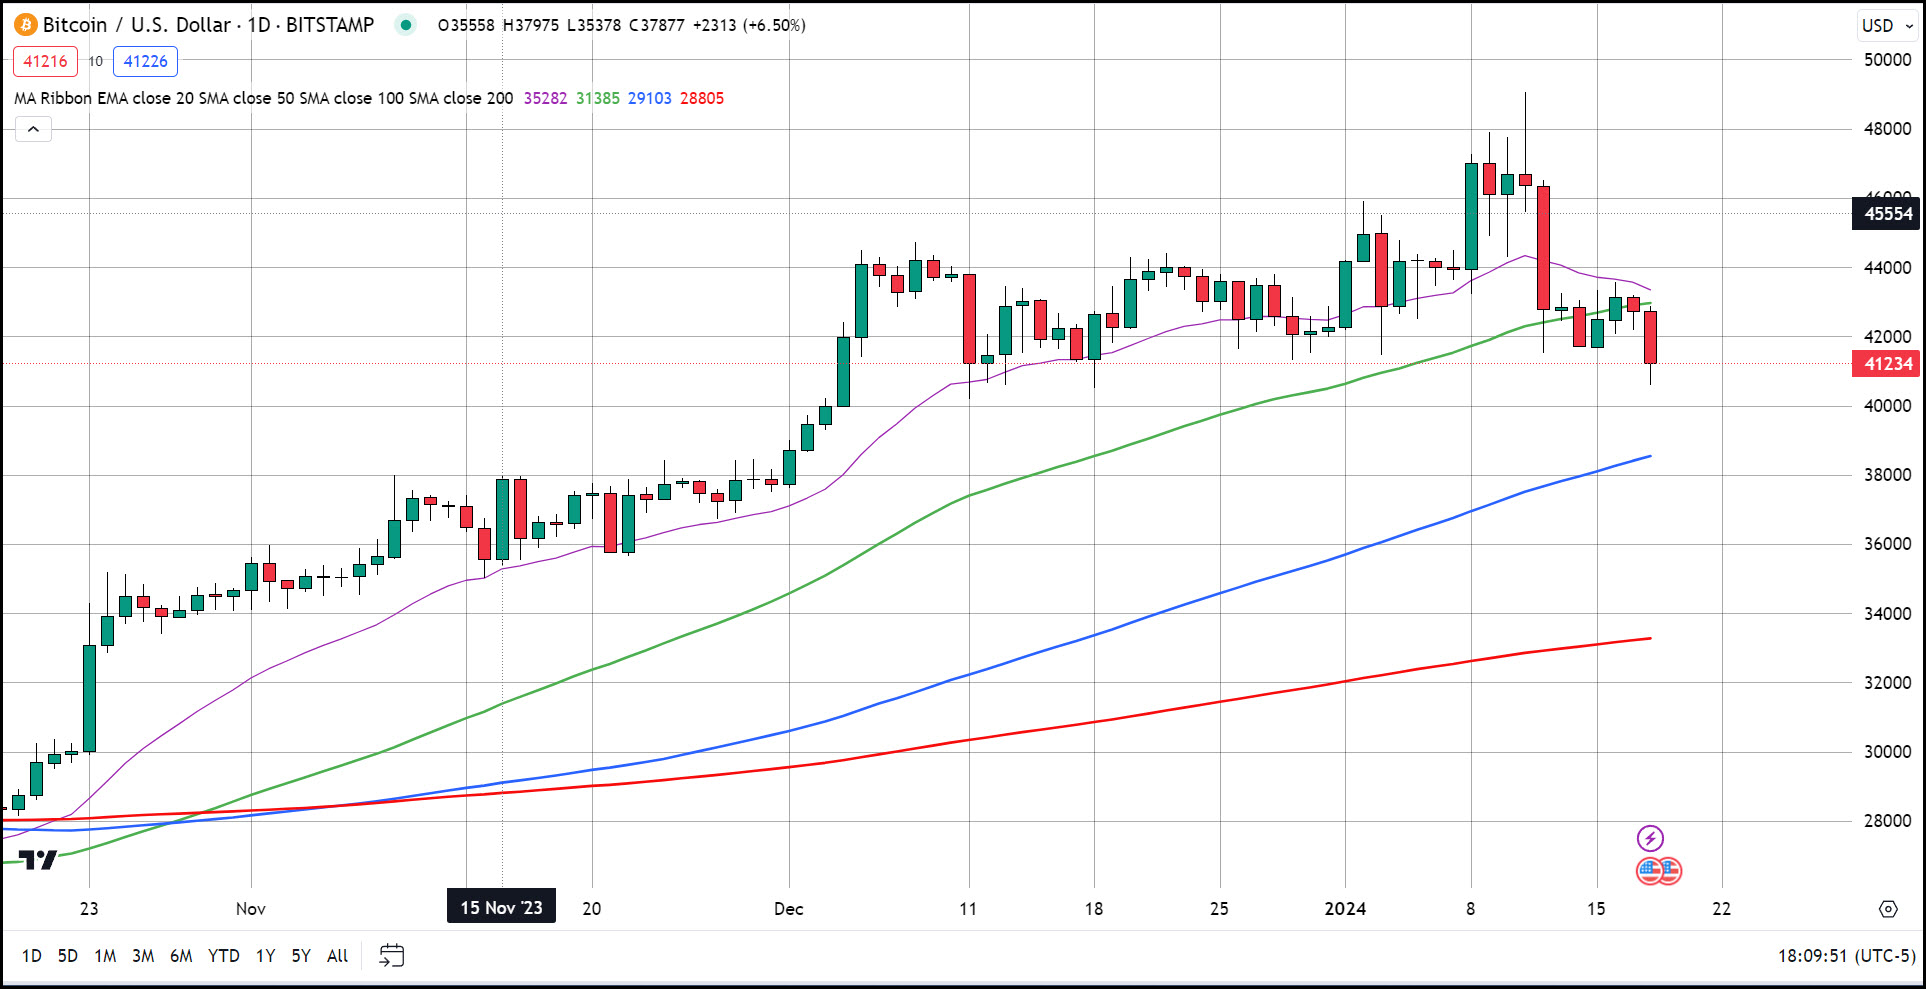
So, what do my favorite averages say about Bitcoin? Last Friday BTC broke below the 20-day EMA and that was part of my reasoning for exiting our long trade initiated in October. Since then that average has become effective resistance confirming my belief that a further decline was imminent. Yesterday we had a unconvincing break below the 50-day SMA followed by today’s confirmation of that bearish indication with pricing opening below the 50-day SMA and moderate price decline. The 100-day SMA would be the next area to look for potential support which coincides with tops in the market from November 9th thru 30th. So, with confluence of other factors, the 100-day SMA currently at $38,500 is the next level of support and the most likely place BTC will visit within the coming days.