Why $20,000 is a critical level for Bitcoin bulls

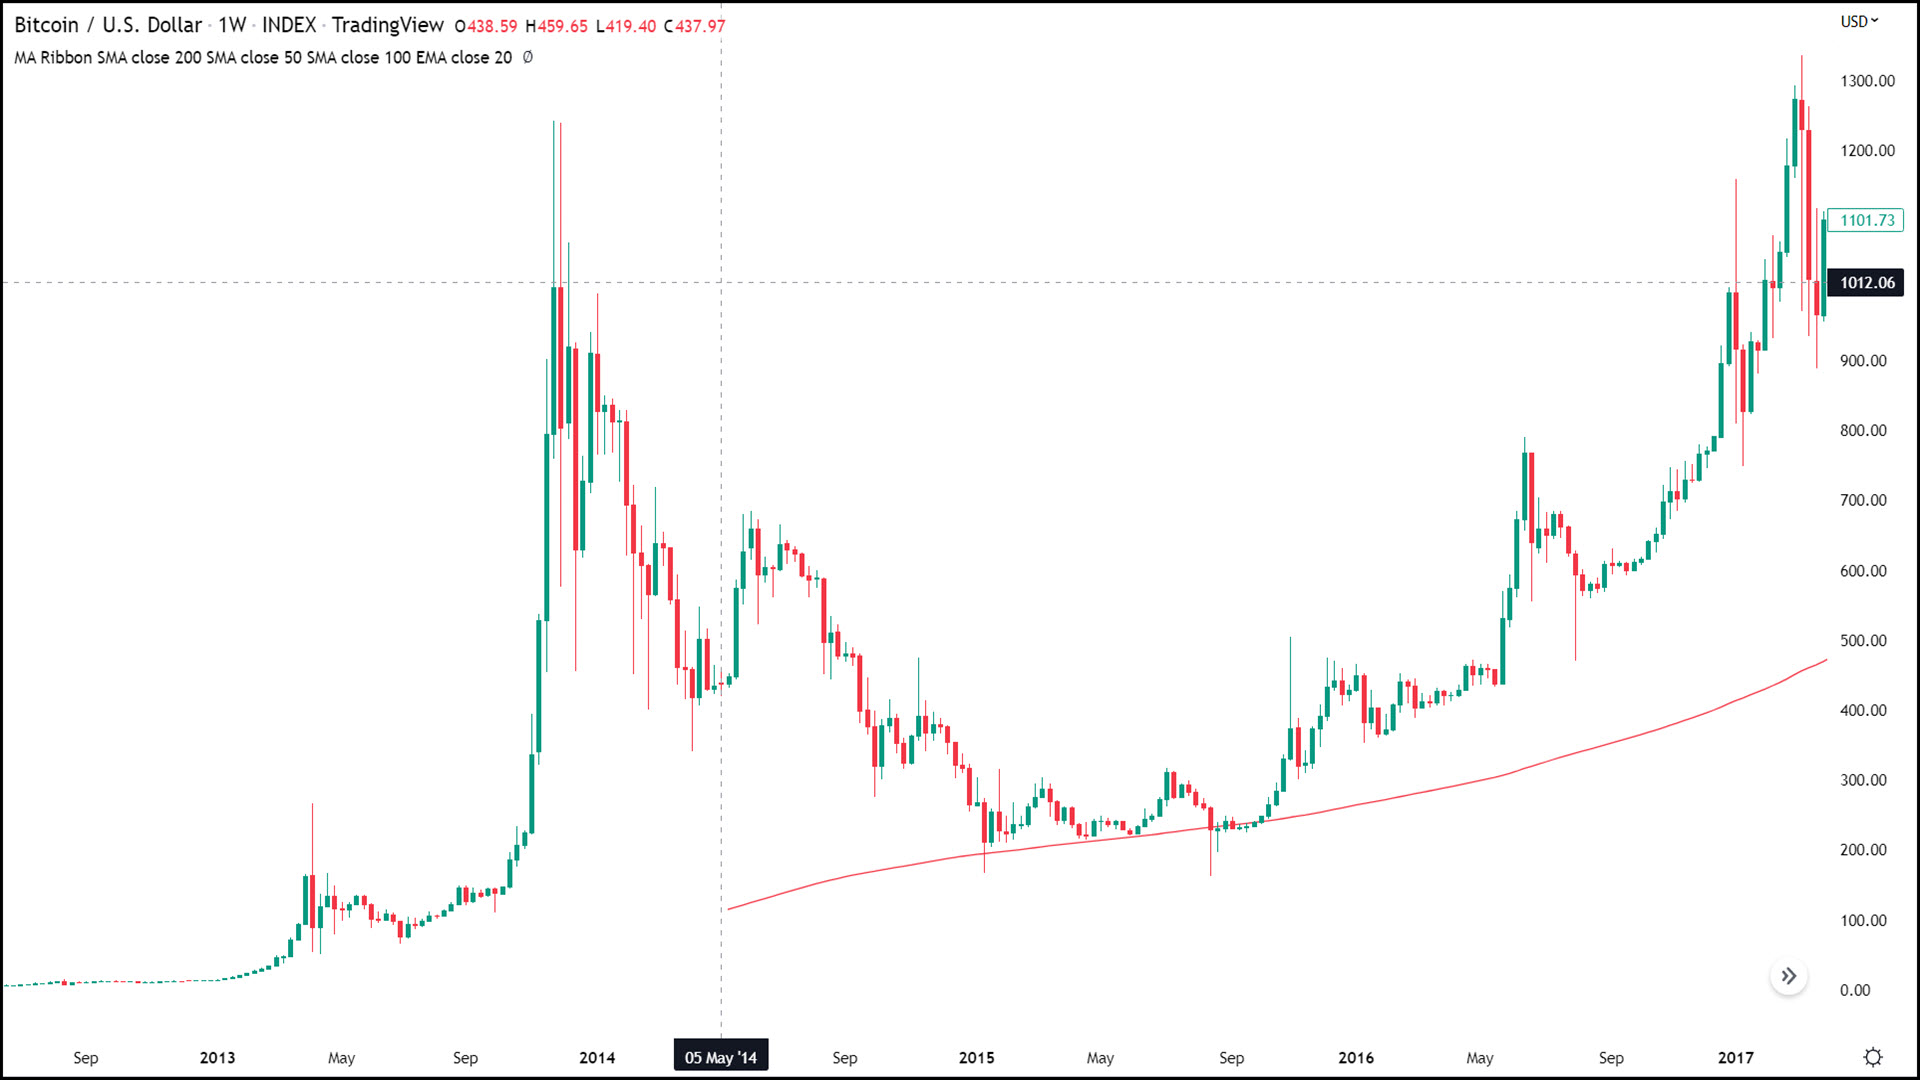
Arguably the most significant level for BTC over the past 5 years is $20k. It was the top of the 2017 rally that brought Bitcoin into the mainstream spotlight, and it was the ceiling back in 2020, that when taken out in mid-December 2020 signaled the moonshot was underway breaching $60k in less than 3 months after cracking the elusive $20k.
One of the three constant truths that I covered in “Bitcoin’s three unbreakable truths” was “…each new parabolic move produced a higher low than the previous”. This tenant of Bitcoin bulls is true when using monthly candles on a closing basis but is hanging on by a thread. If we were to close out August below $19,749 this decades-long constant would be broken.
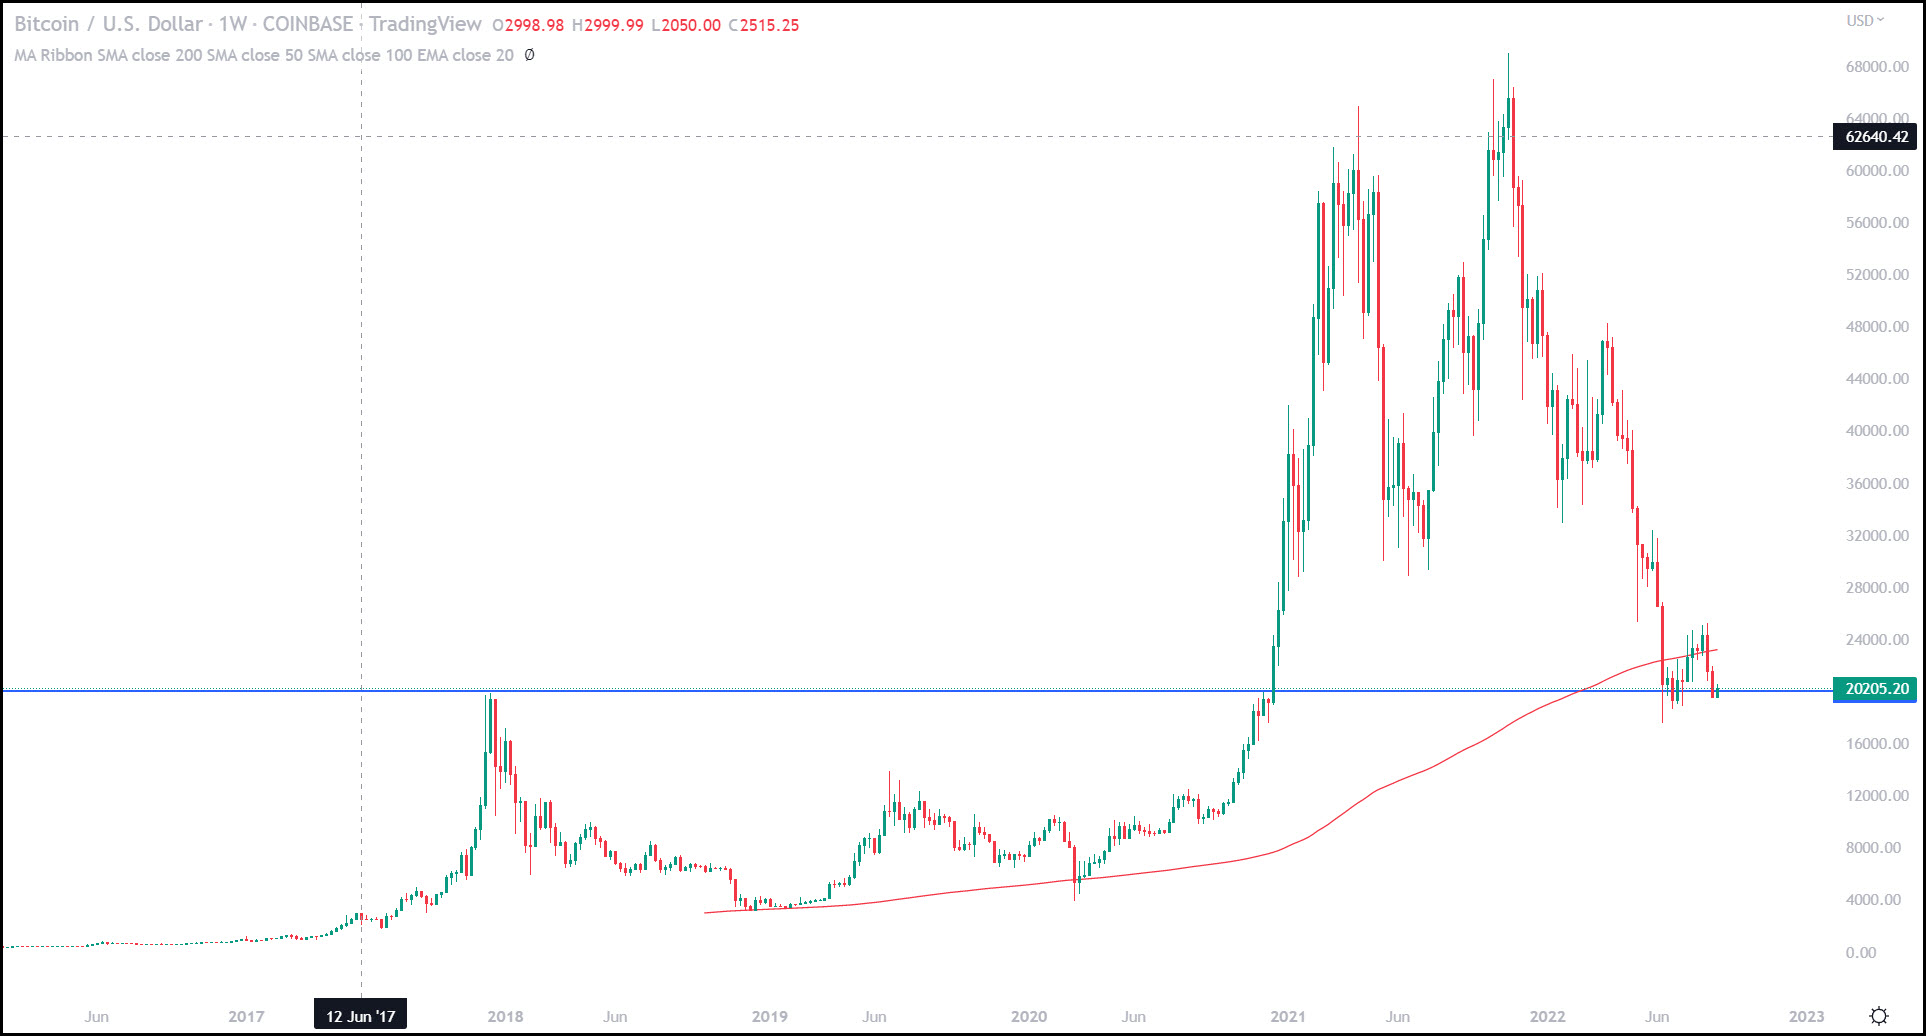
If $20k does not act as effective support here and we get a clear break below it then the levels of $14,000 come back into play. It would signal another massive breakdown of sentiment in short-term holders and signal another long leg to the downside.
In my previous article mentioned above, I noted that every parabolic move in Bitcoin was followed by a retracement of 78% - 96%. We are in the fifth iteration of Bitcoin’s parabolic cycles that are made up of three parts: Rally, Retrace, Consolidate. Back in July of this year, we hit the minimum retracement level (78%) just briefly in intra-day trading. However, if we get a break below $20,000 then we will probably see a “real” visit to the 78% retracement or likely much lower. The retracement used goes from $3,880 up to $69,000.
If this scenario does play out then Bitcoin no longer has the claim of higher lows that never trade lower than the previous top. This is a cornerstone of Bitcoin’s bullish case and if proven incorrect the fallout in confidence may be greater than that of the price.
Bitcoin’s bull case beginning to break down
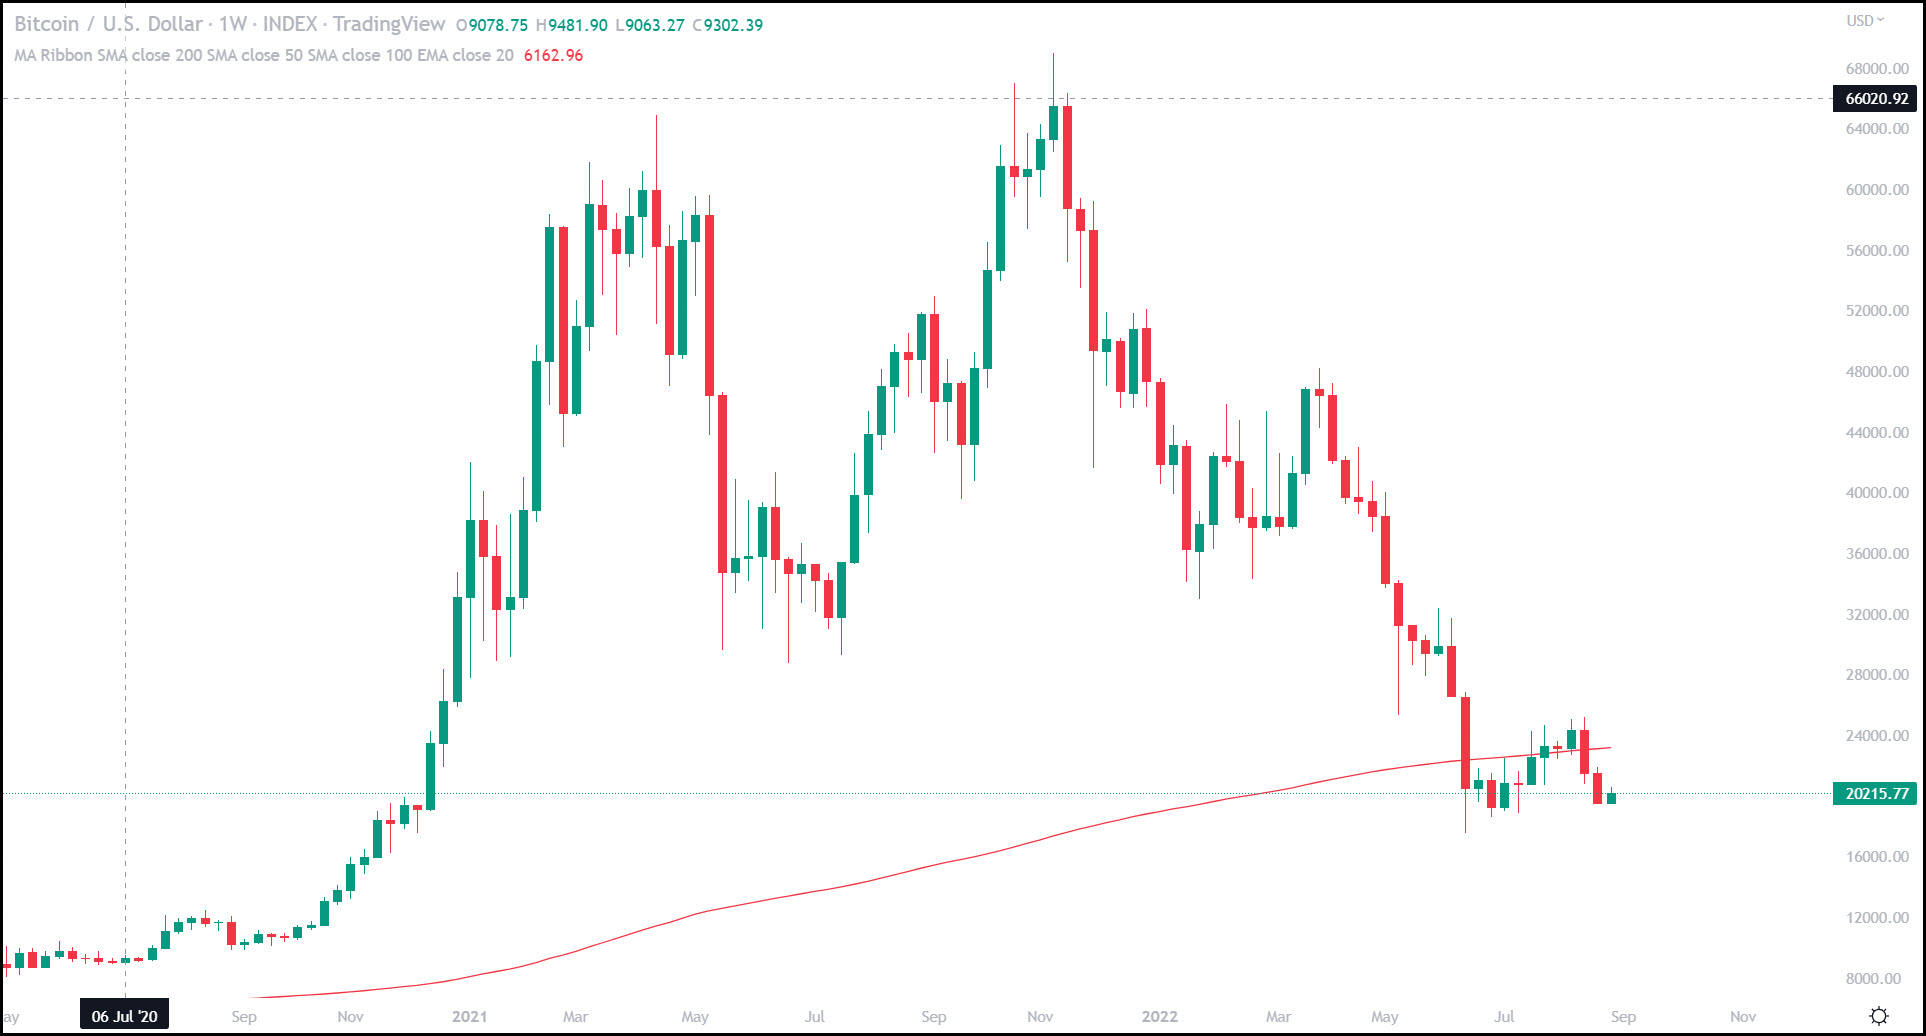
Another long-term theme in Bitcoin’s technical chart data that is at serious risk of being made invalid is the relationship between price and the 200-week simple moving average. Since its start, at the beginning of 2015, the 200-week SMA has served as an effective bottom for every major correction that Bitcoin has faced. Although pricing did break below this indicator on two instances in 2015 and during the 2020 Covid crash the dips below the 200-week SMA were extremely short-lived, with only two weekly closes below this important moving average up until this year.
That narrative has changed as of recent as we now are on course for a 9th weekly close below the 200-week SMA since mid-June. More alarming than this seven-year support level no longer standing is how pricing has reacted to it this time. Since breaking below this average for the third time in history (on a weekly basis) the 200-week SMA has actually acted as resistance several times since mid-June.
The breakdown of these bulletproof bullish traits of Bitcoin’s price action could be signaling a further drawdown in the cryptocurrency. The price can recover and I believe at some time it surely will, but the damage done to Bitcoin’s reputation is more worrisome as it can never truly recover or regain the bullish arguments it has lost over the past few months.