Tuesday, April 19, 2022 - 17:12
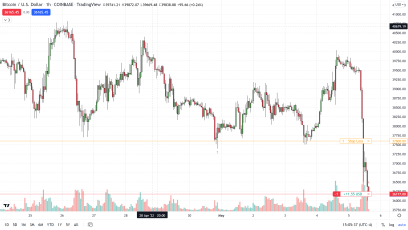
Today Bitcoin continued to gain ground after hitting a low of $38,500 before making a dramatic recovery. Currently, as of 3:00 PM ET Bitcoin is trading at around $41,440. That equates to a gain of 1.65% or $700 for the flagship cryptocurrency on the day and a $2,000 gain so far for the week.